Get Insights on Your Visits and Performance
Learning Objectives
After completing this unit, you’ll be able to:
- List embedded dashboards.
- Review the highlights of your last store visit with the Last Visit Store Performance dashboard.
- Evaluate key trends in your performance with the My Performance dashboard.
- Analyze the compliance and performance metrics of a store with the Store Insights dashboard.
- Outline how merchandisers can use CRM Analytics dashboards.
Insights at Your Fingertips
In this unit, we explore dashboards that can be embedded on Lightning Experience page layouts. Embedded dashboards show analytics on store performance, product whitespaces, field rep performance, field reps’ last store visit, and account performance. The data shown in these dashboards is based on the person viewing it and the record being viewed. Embedded dashboards include the following.
- Store Insights
- Store Embedded
- Whitespace Embedded
- Account Embedded
- My Performance - Desktop Embedded
- Last Visit Store Performance.
Let’s find out how Chantelle Arceo, the versatile field rep at Alpine Group, uses the dashboards to gain insights into her visits.

In Hindsight
Chantelle just completed her visit at the Alpine Nutrition - San Francisco store. She’s keen to look at the highlights of the visit and note what changed from the last visit. She launches the Retail Execution mobile app and opens the Last Visit Store Performance dashboard embedded on her home page. This dashboard has two tabs:
-
Store Compliance: This tab displays compliance metrics related to product facings, share-of-shelf placements, out-of-stock products, promotions, and inventory availability.
-
Task Completion: This tab shows the number of tasks assigned for the visit, broken down by status:
- Number of total tasks
- Number of completed tasks, both required and optional
- Number of required tasks
- Number of required tasks, marked required
She taps the Store Compliance tab and observes that the inventory compliance metric has improved since her last visit. She’s quite happy to see the 100% promotion compliance metric—it took a lot of hard work to achieve this!

Next, she taps the Task Compliance Rate tab.
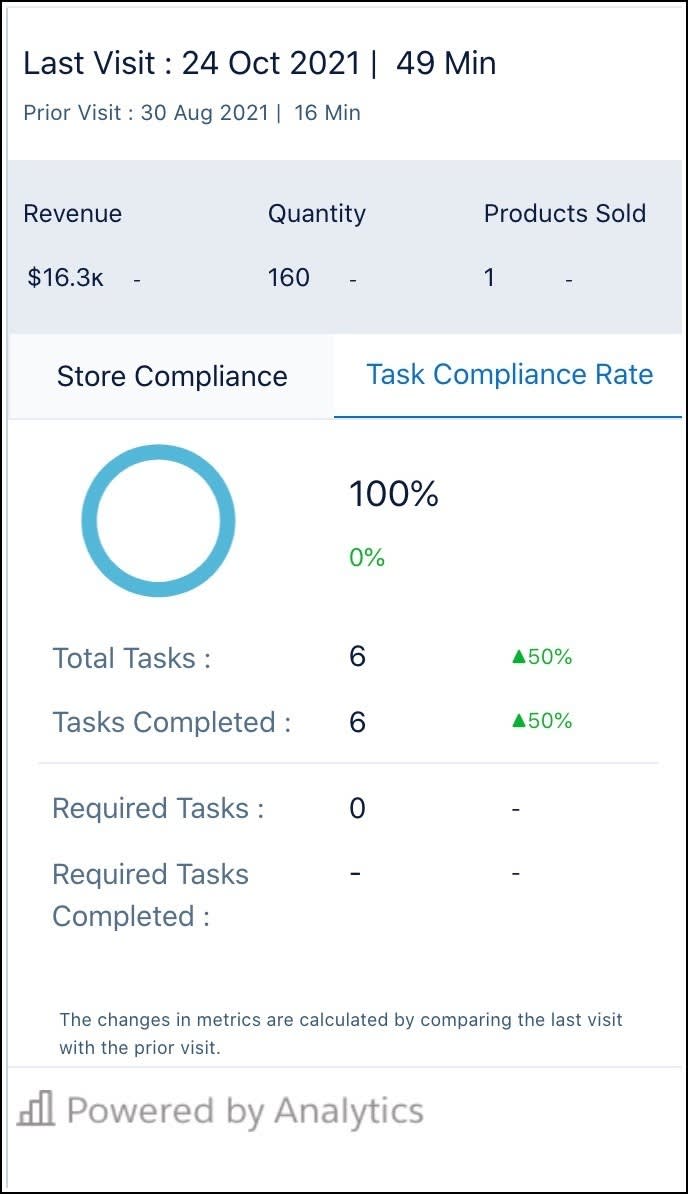
It shows that she’s completed all of the six tasks and has secured 100% compliance. Next, she wants to understand how well she’s doing her job lately.
How Productive Am I?
Chantelle wants to keep a close eye on the number of productive visits as Gustavo has advised her to do so. On the home page of the Retail Execution app, Chantelle finds the My Performance dashboard. It shows the aggregate revenue incurred by the stores she’s associated with, average store compliance trends, the composition of sales by product category, and store visit performance.
She notes that her store compliance percentage is 85%, which is more than the 79% team average. Her percentage of productive visits is 80%, which is below the team average of 87%. She can tap View Compliance KPI if she wants to see the trends of all compliance metrics.
While on the dashboard, she wants to identify her top-selling product category so she can upsell it in her upcoming visits. On the Categories Sold card, she taps View Product KPI. The dashboard expands two new cards: Top Contributing Products and Lowest Contributing Products.
She notices that the Energy Drinks product category is contributing significantly to product sales. She taps the product category name in the pie chart to see the highest and lowest contributing products. The Tart Cherry energy drink is the highest contributing product in this category. When she meets the store manager again, she’ll encourage them to add the product to the store’s portfolio.
Speaking of her next visit, it’s already time for her to drive to the next visit location Gustavo scheduled for her.
Where to Next?
Chantelle is off to her next visit at the Alpine Nutrition - Union Square store. Before stepping into a store, Chantelle examines the Store Insights dashboard to make the most of each visit. To go to the dashboard, she opens the Alpine Nutrition - Austin store record. Tapping the Insights tab, she finds the Store Insights dashboard that the admin had embedded for her.
This dashboard illustrates trends related to revenue, average store compliance, visits, tasks, open cases, products, and the store’s Net Promoter Score (NPS).
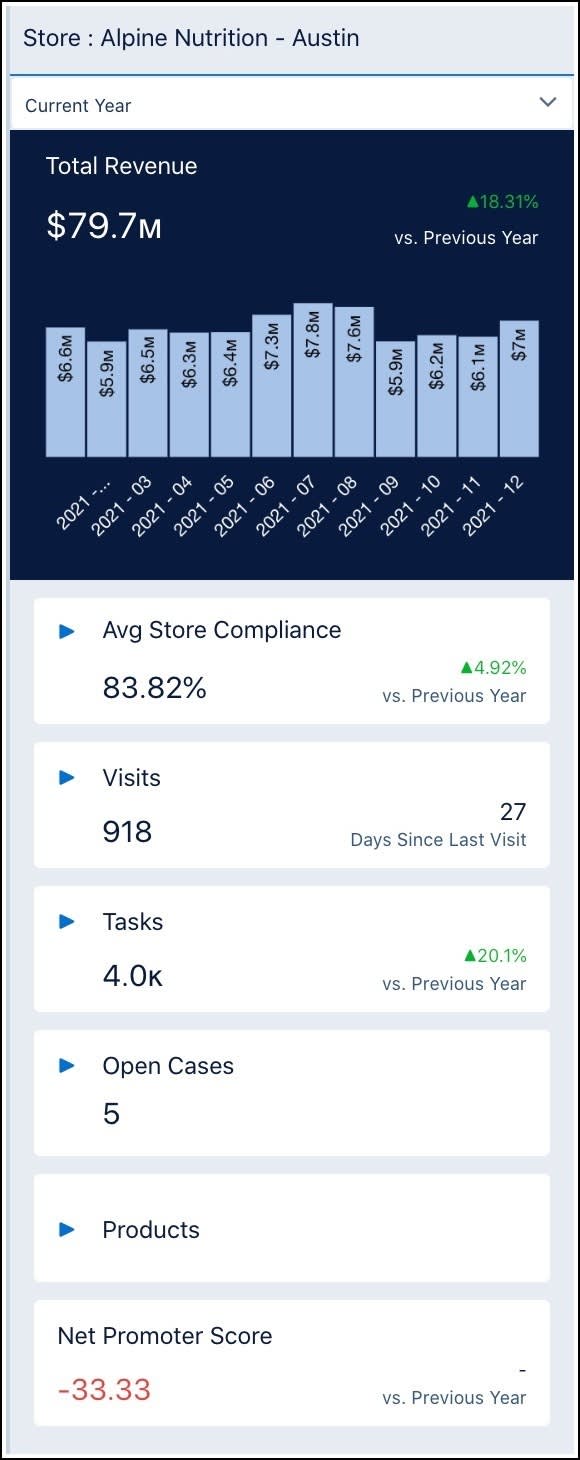
Chantelle is surprised to see five open cases at the store. To go deeper, she taps  on the Open Cases card. This expands the card with the list of open cases and related information.

She goes through the table and concludes that cases related to late deliveries far outnumber other cases. She makes it a point to talk to the store manager at Alpine Nutrition - Austin and get their recommendations on improving this.
Chantelle’s glad that she could get so many useful insights through CRM Analytics dashboards. And she’s better prepared than ever to perform her duties.
A Merchandiser’s Metrics
So far, we’ve seen how sales managers like Gustavo and field reps like Chantelle can use CRM Analytics dashboards to optimize retail execution operations. But there’s one more person who can benefit from these dashboards: Jimothy Albert, the merchandiser at Alpine Group.
Here are a few tasks Jimothy is responsible for.
- Keeping tabs on store compliance
- Regularly replenishing inventories
- Ensuring that products are on the right shelves
- Overseeing promotional activities
- Tracking field reps’ tasks and visits
- Analyzing product and store cash flows
And here are some CRM Analytics dashboards that can help him with these tasks.
- Sales Manager Home
- Territory Performance
- Store Performance
- Product Performance
- Field Rep Performance
- Store Insights
- Store - Embedded
- Account Embedded
- My Performance - Desktop Embedded
- Last Visit Store Performance - Desktop Embedded.
To learn more about merchandiser dashboards, see Merchandiser Dashboards.
Get Data-Savvy
We’ve discovered how Alpine Group’s employees use CRM Analytics dashboards to get credible, actionable insights. With the ability to analyze data as per their needs, they can learn from their past and plan their future. CRM Analytics dashboards have a range of uses: analyzing region-specific problems, tracking aisle-level compliance metrics, predicting the effectiveness of promotions, capitalizing on whitespaces, and recognizing patterns in field rep performance. CRM Analytics has infused AI-driven business smarts into the ever-evolving, dynamic world of retail execution.
Resources