Evaluate Insights on Territory and Store Performance
Learning Objectives
After completing this unit, you’ll be able to:
- Review sales trends and team performance with the Sales Manager Home dashboard.
- Review territorial performance metrics with the Sales Manager - Territory Performance dashboard.
- Check store sales and compliance trends with the Sales Manager - Store Performance dashboard.
- Explore the correlation between key performance indicators with the Sales Manager - Store Performance dashboard.
The Frontpage of Insights
At the start of each day, Gustavo opens the Consumer Goods app and examines the Sales Manager Home dashboard on the home page. This dashboard gives him an overview of his territory’s revenue trend, stores and products that need attention, ranking of sales reps by revenue, and potential cross-selling opportunities.

Gustavo notices a 24.94% loss of revenue this quarter and a fall in this week’s revenue on the Territory Revenue card. He finds this worrisome and wants to dig deeper into this metric. By clicking More metrics in the Territory Revenue card, he finds himself on the Sales Manager - Territory Performance dashboard.
How’s My Territory Doing?
The Sales Manager - Territory Performance dashboard can be used to gauge the weekly performance of your territory and analyze the lowest cities within that territory for the selected KPI. You can further review the performance of accounts within a hierarchy, stores and store groups, and products and product categories.
Gustavo wants to analyze the performance of NTO stores in his territory for the current fiscal year. To do this, he first clicks the Parent Account global filter and selects Northern Trail Outfitters. He then clicks the Duration global filter and selects Current Fiscal Year. As he wants to assess the revenue intake of each region, he selects Revenue as the KPI.

He investigates the two charts in the How’s my territory performing? section: the weekly revenue trend, and performance by city. Gustavo notices that out of all cities with NTO stores, New Orleans ranks at the bottom. Seeing a significant drop of 35.65% in revenue, he decides to probe into the possible pain points. He selects New Orleans to filter the data as per that city.

He goes to the area where he sees the tabs Account, Stores, and Products. Gustavo clicks the Stores tab and views store performance in New Orleans. He jots down the names of the stores with less than $80,000 revenue so that he can explore ways to increase Alpine Group’s earnings from these stores.

Next, he views store group performance. Gustavo observes that the Northeast store group is the store group with the least revenue in New Orleans.

Stores’ Stories
Now that Gustavo knows that NTO stores in the Northeast store group are trailing behind, he wants to assess the general performance of all the stores in that group.
To do so, he opens the Sales Manager - Store Performance dashboard. This dashboard has two views.
-
Performance: In this view, Gustavo can see the comparative performance of stores, the change in performance for each store, and the trend of their performance over time.
-
Correlation: Here, he can view the correlation between store performance and relevant KPIs. He can also evaluate the relationship of field rep visits with store revenue and compliance metrics.
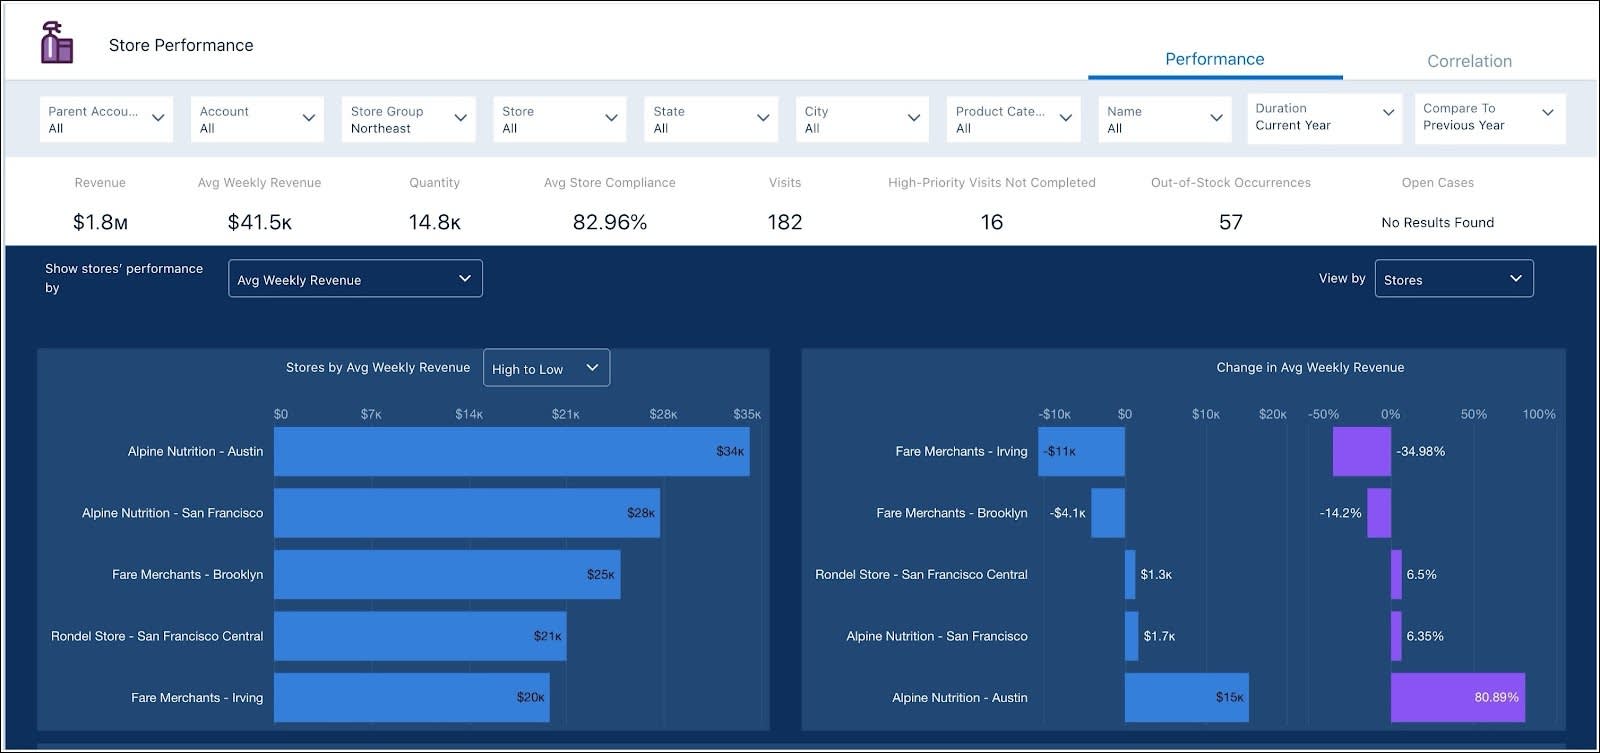
He starts with the Performance view. He chooses Northeast in the Store Group global filter. This dashboard view presents the best and the worst-performing stores and weekly changes in these values. Gustavo selects the Avg Weekly Revenue metric and chooses to view it by Stores.
Seeing the Stores by Avg Weekly Revenue card, he is delighted to know that two new Alpine nutrition stores are performing well, each with above $25,000 weekly revenue. However, the excellent performance of these stores has been offset by two stores in the store group that are not performing as well as expected.
Further down, Gustavo views a line chart showcasing average weekly revenue rates this year. The chart also presents forecasted rates for the next four weeks. The forecast is based on historical data and has upper and lower confidence limits. These projections help Gustavo better anticipate the future cash flow and plan accordingly.

In the Details section, Gustavo checks if something stands out in the KPIs of the three lowest-performing stores.

He spots a low out-of-stock compliance average in Alpine Nutrition stores Austin and San Francisco. He wonders if a low average out-of-stock compliance contributes to low revenue. If so, how can he increase out-of-stock compliance? Gustavo can use the Correlation view to find the answers.
Correlate and Coordinate
Gustavo opens the Correlation view to check how retail execution compliance affects performance outcomes. First, he wants to determine the impact of out-of-stock inventories on the bottom lines of the stores in the Northeast store group. To do so, he sets the KPI on the y-axis to Avg Weekly Revenue and on the x-axis to Avg Out-of-Stock Compliance. He makes sure that the Store Group global filter is still set to Northeast.

Looking at the resultant scatterplot graph, he finds that in most cases, the out-of-stock compliance increases along with weekly revenue. To put it simply, regularly topped-up shelves get more sales. Perhaps it’s time for field reps to increase their visits to stores and restock shelves more frequently. This way, customers can always find their favorite products on the right shelves!
Next, Gustavo’s eager to know if the number of visits by field reps increases overall store compliance rates. He selects the dashboard How are the store visits affecting store compliance and revenue? to investigate this. He chooses the Avg Out-of-stock Compliance as his first KPI and the Number of Visits as his second KPI.
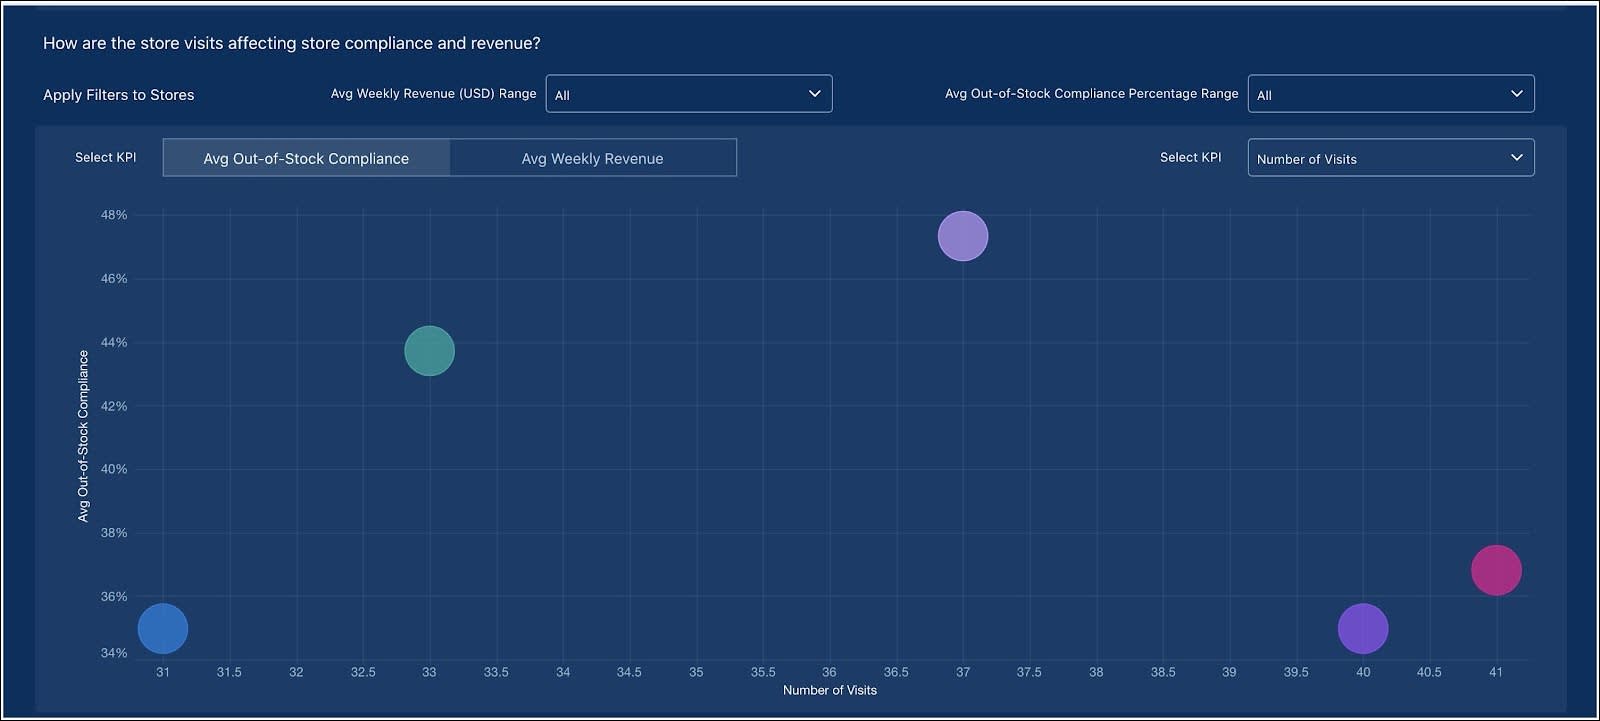
Gustavo concludes that more visits to a store generally lead to better control and higher storewide compliance rates. He hovers over the stores that are toward the bottom of the graph to quickly peek into their exact number of visits and compliance percentages. He plans to schedule more visits to these stores to push up their compliance levels.
The Store Embedded dashboard, which is similar to the Sales Manager - Store Performance dashboard, can be embedded into the Retail Store record page layout to assess a store’s compliance and sales performance.
Gustavo has evaluated territorial performance, identified store-specific pain points, and established the association between store revenue and out-of-stock compliance. We see next how he views the performance indicators of products and assortments, detects cross-selling opportunities in stores, and analyses his team’s performance.
Resources