Analyze Assortments and Product Performance
Learning Objectives
After completing this unit, you’ll be able to:
- Study the distribution of assortments based on compliance and sales metrics with the Product Performance dashboard.
- Track key performance metrics and promotion effectiveness of products with the Product Performance dashboard.
The Assortment Scoreboard
Gustavo has analyzed the stores and identified certain areas of improvement. He shifts his attention to products sold within these stores. He can track products on the Product Performance dashboard. This dashboard has four tabs: Product Category, Brand, Assortment, and Product. To only see figures related to NTO stores, Gustavo sets the global filter for Parent Account to Northern Trail Outfitters.
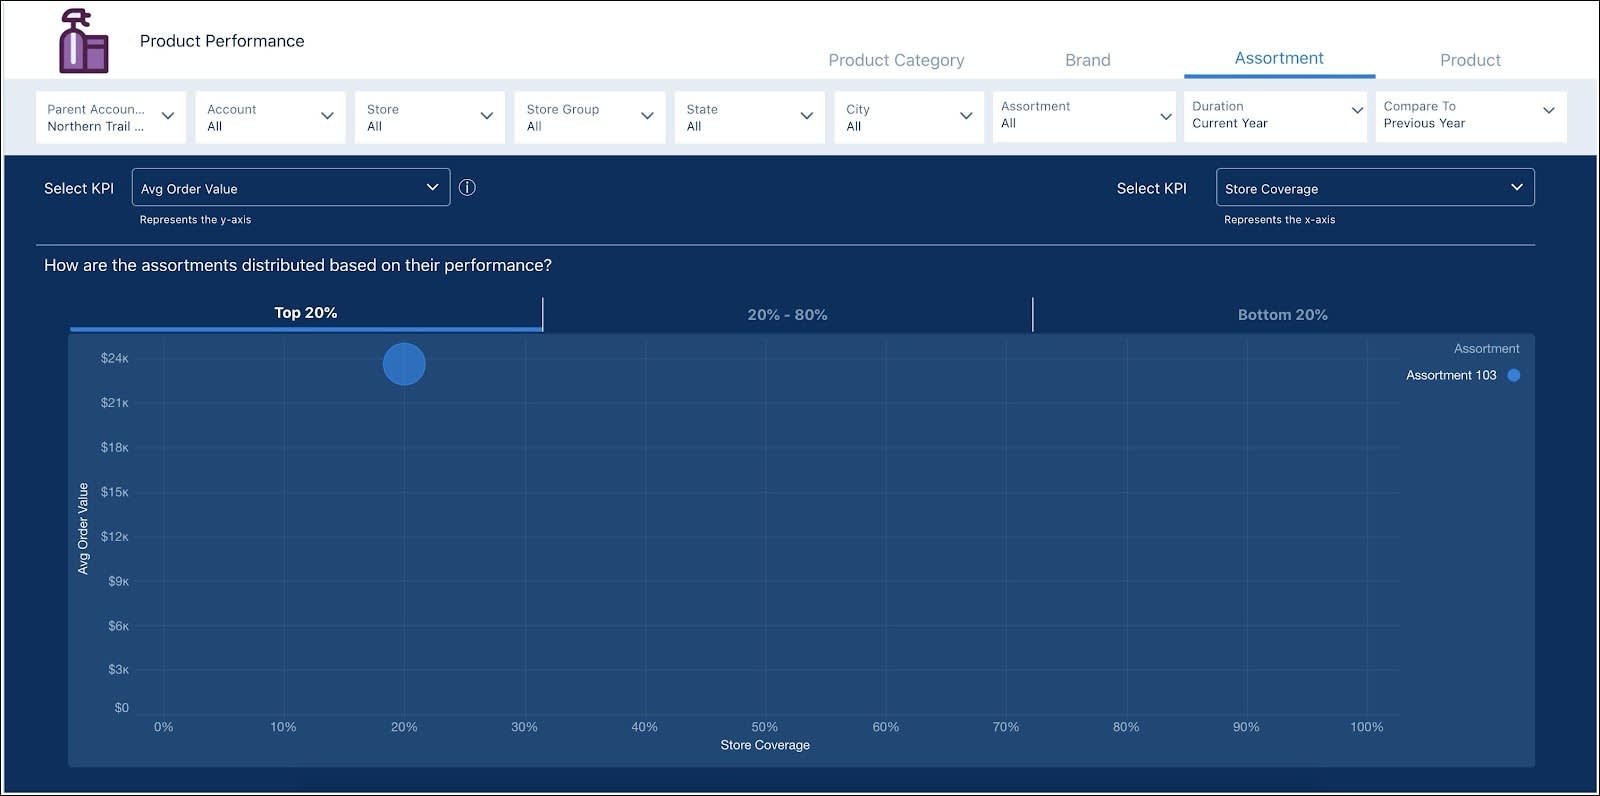
He starts with the Assortment tab. He sees a chart that segregates all assortments based on their performance in three categories: Top 20%, 20% - 80%, and Bottom 20%. Clicking a category shows the associated scatterplot chart. He selects the Avg Order Value KPI for the y-axis and the Store Coverage KPI for the x-axis. While the average order value would tell him the amount of dollars spent for every order of a product, the store coverage would indicate the percentage of stores where this assortment is available.
He begins with the Top 20% tab and notices an assortment in this category: Assortment 103.
Next, he goes to the 20% - 80% category and spots three assortments.

Gustavo notices that even with a store coverage of 20%, the average order value of Assortment 102 is higher than other assortments. He is impressed by this performance and clicks Assortment 102 within the graph to find out more.
In the Assortment 102 Performance chart, Gustavo can see the average order value and store coverage of the assortment for the current year. He observes a swift rise in the assortment’s average order value in the past two weeks despite equal store coverage. This indicates that the products in this assortment are in high demand and people are buying them more often.

Further down, he finds the Overall Performance metrics. He notes an impressive 8.41% increase in Assortment 102’s revenue this week, with around 3% increase in the average order value. To find out if all products in this assortment are contributing equally to this assortment’s value, he checks the Details section.
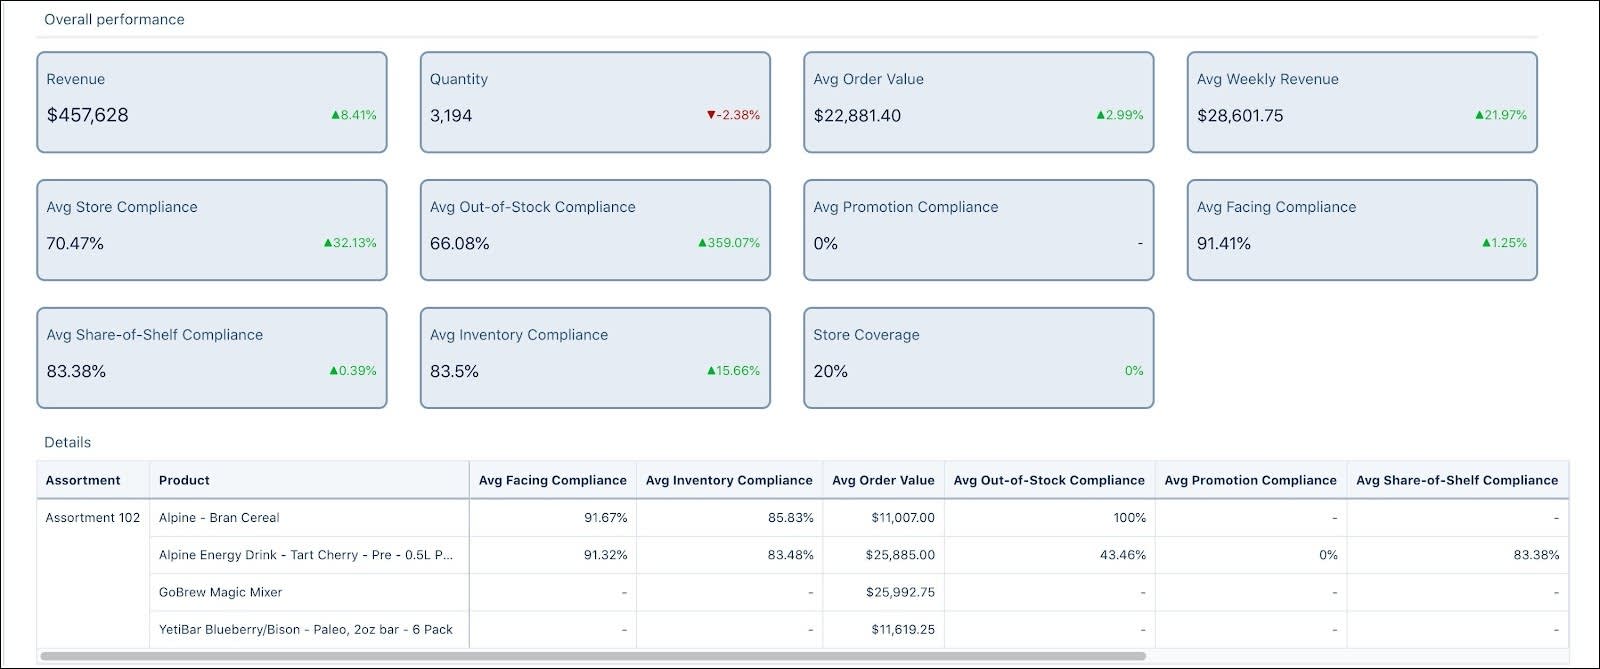
Gustavo scans through the metrics of the five products in this assortment and is able to identify two significant metrics.
- The Alpine - Bran Cereal, which has a relatively low store coverage of 6.67%, has a striking $22,014 average weekly revenue.
- The YetiBar Blueberry/Bison - Paleo, 2oz bar - 6 Pack, with a high store coverage of 13.33%, has a much lower $11,619 average weekly revenue.
Gustavo is intrigued by the performance of these products and wants to further analyze the difference between them.
Take Stock of Your Products
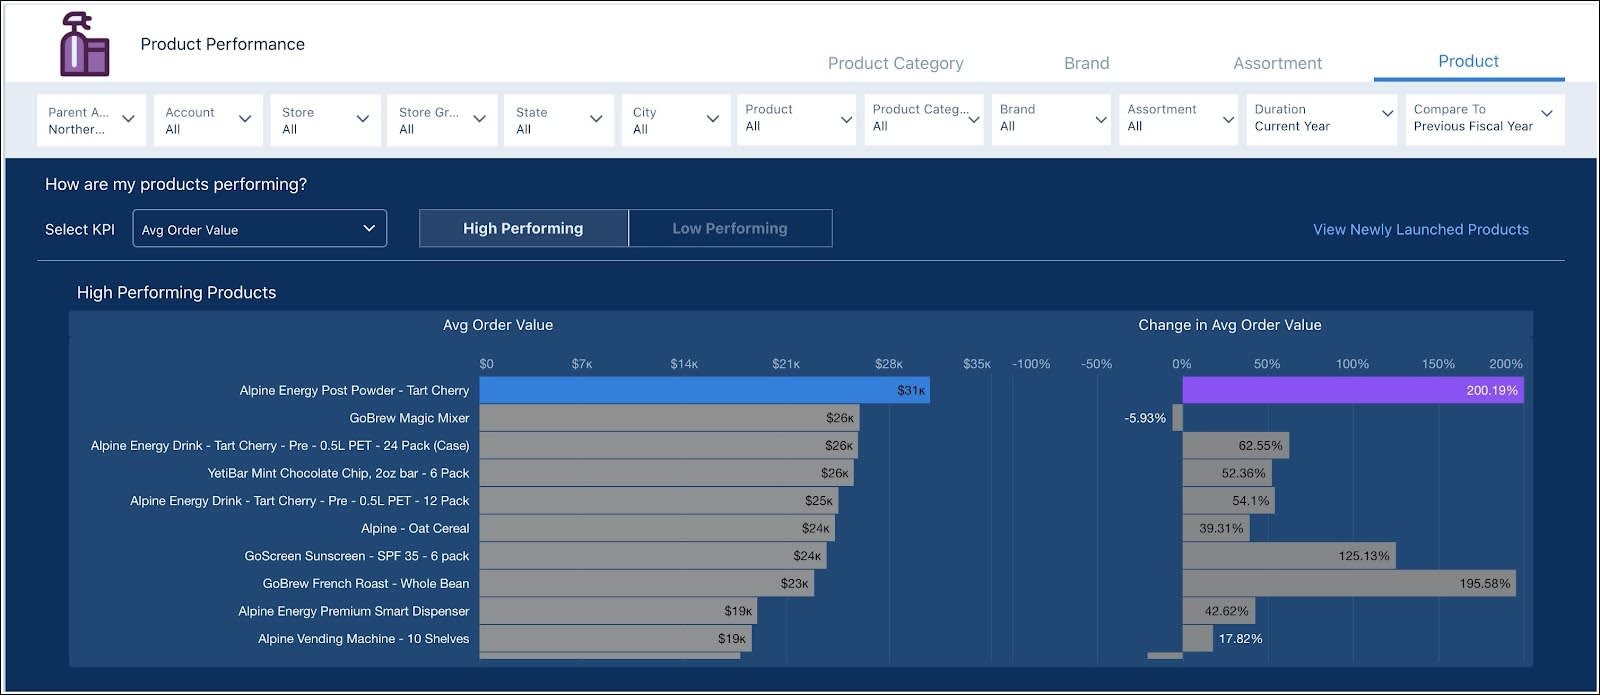
Gustavo opens the Product view to analyze the performance of the Alpine - Bran Cereal and the YetiBar Blueberry/Bison - Paleo products. He ensures that the global filter for Parent Account is still set to Northern Trail Outfitters. As he wants to compare the product’s performance with the sales trends of the past year, he selects Previous Fiscal Year for the Compare To global filter. He then chooses to view performance based on the Average Order Value KPI since this metric would help him gauge customers’ purchasing behavior.

He would first like to understand YetiBar Blueberry/Bison - Paleo’s shortcomings. He views the How are my products performing? card and notices a significant decrease in its average order value since the last year compared to some other products. He clicks the YetiBar Blueberry/Bison - Paleo, 2oz bar - 6 Pack product bar to go deeper.
He views the YetiBar Blueberry/Bison - Paleo, 2oz bar - 6 Pack Performance chart which showcases the weekly performance trend of this product. Gustavo observes that the average order value for the product YetiBar Blueberry/Bison - Paleo has been steadily rising in the last five weeks, before which it had stayed low for a considerable period of time.

In the Overall Performance section, he assesses all relevant KPIs related to the YetiBar Blueberry/Bison - Paleo product to find a sharp decline in revenue, quantity, and average order value for the product as compared to other products in the same assortment.
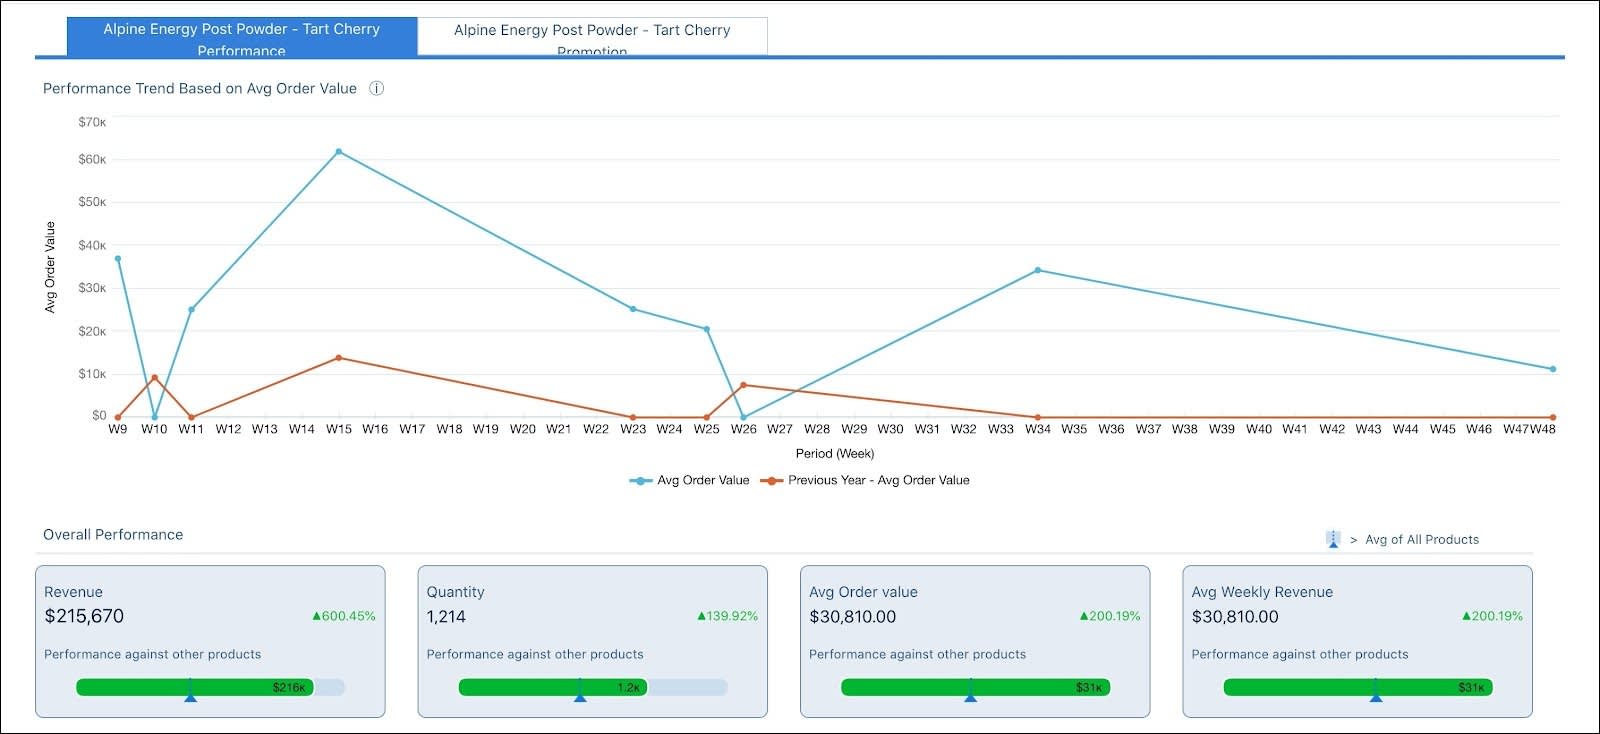
Gustavo carries on, and wants to review the performance of the top performing product in the assortment, namely the Alpine Energy Post Powder - Tart Cherry product. To do this, he selects the Alpine Energy Post Powder - Tart Cherry product bar.
Here, Gustavo notices a significant increase in revenue, quantity, average order value, and average weekly revenue in the current year, which tells him that there’s a growing demand for the product among consumers. Gustavo makes a quick note of this.
Gustavo has been able to read the charts and gain valuable information about the change in revenue and average order value of two different products in the assortment. One product is not doing good while the other is performing quite well.
In the next unit, we follow along as Gustavo analyzes product whitespace opportunities and his team’s performance.
Resources