Get Started with Tableau
Learning Objectives
After completing this unit, you’ll be able to:
- Explain how Tableau helps nonprofits meet their mission.
- Describe several use cases for Tableau at a nonprofit.
- Explain how your nonprofit can get access to Tableau.

Before You Start
Before you start this module, consider completing the following recommended content.
Use Data to Build a Better World
Your nonprofit accumulates more information now than ever before about program participants, supporters, and donors. Do you know how to find the most relevant data? Is it siloed in spreadsheets, locked in databases, or hidden by the sheer volume of information?
Enter Tableau, an analytics platform designed to help people like you see and understand data. Tableau helps any organization quickly answer questions with data and share insights using powerful, interactive dashboards.
With Tableau, nonprofits can connect to their data, combine it with other data sources, and explore it in visualizations—called vizzes—that highlight trends and outliers. You can share vizzes securely across your organization, with your board of directors, and with your donors and other external supporters.
Consider the executive summary screenshot, which contains many vizzes focused on fundraising, such as active donor trends and sources of donations.

It’s just one example of how Tableau can help nonprofits create a data-first culture. This helps leaders and staff make better decisions about how to increase donations, deliver better services, and measure impact.
In this module, you learn the basics of using Tableau at your nonprofit, plus how to get started with Tableau Accelerators and other resources. You won’t go deep into setting up and using Tableau, but the Resources section lists several links to help you with those tasks.
You start here with common nonprofit use cases for Tableau. Along the way, you follow the example of Hunger No More International (HNMI), an international nonprofit working to end hunger and promote healthy food options. HNMI uses Tableau across its organization. Let’s explore how.
Analyze Donor Behavior
Tableau helps development teams analyze supporter data to help increase donor engagement. It can also combine donor data and external data sets—like demographic, wealth, and consumer data—to surface patterns that help you target new supporters.
HNMI’s Fundraising team focuses its Tableau analysis on retaining current donors first, because it’s more cost-effective to retain donors than acquire new ones. HNMI connected data from its Salesforce org to Tableau to create more vizzes and dashboards to meet the Fundraising team’s needs.
From these dashboards, the Fundraising team can:
- View and explore individual donor profiles.
- Review funding results, performance, and campaign analytics.
- Answer questions about their team’s strategy and performance.
Check out their campaign efficacy dashboard.
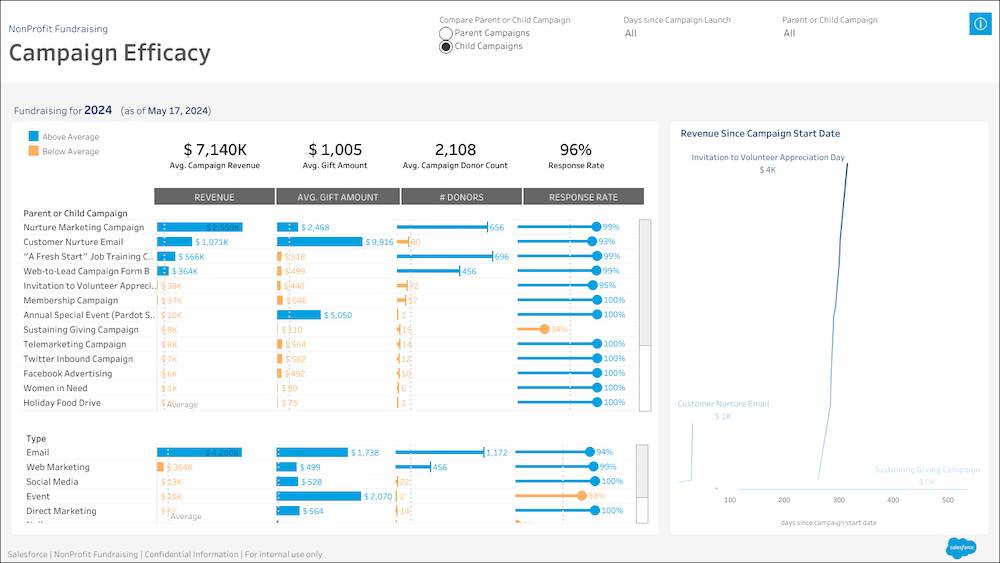
This dashboard shows the revenue, response rate, average gift amount, and other key metrics for a fundraising campaign.
Recently, HNMI’s Fundraising team looked at its campaign results for the last quarter. They noticed that donors younger than 35 were more likely to respond to donation requests that focused on HNMI’s advocacy work. The team also found higher conversion rates for the same segment of donors with text-messaging campaigns. The Fundraising team now uses these findings to target young professionals with a mobile-first campaign focused on advocacy for youth hunger programs.
As the campaign runs, the Fundraising team can use their Tableau dashboard alongside Tableau Pulse, which gives them a personalized digest of key metrics like response rates for key demographics.
Leadership and the rest of the team can even use natural language to ask questions of the data as a starting point for further exploration. For example, “How many gifts have we brought in this year?” What’s more, Tableau Agent can suggest questions to dive deeper into the dataset, help build visualizations, and work with calculations.
Together, these tools help you see the big picture and make faster, data-driven improvements to your fundraising campaigns.
Monitor and Report on Impact in Real Time
Tableau is also a powerful tool for determining program results and telling stories about your impact to both internal and external audiences.
HNMI uses Tableau to analyze the impact and effectiveness of its programs. Here’s HNMI’s ready-to-use dashboard.
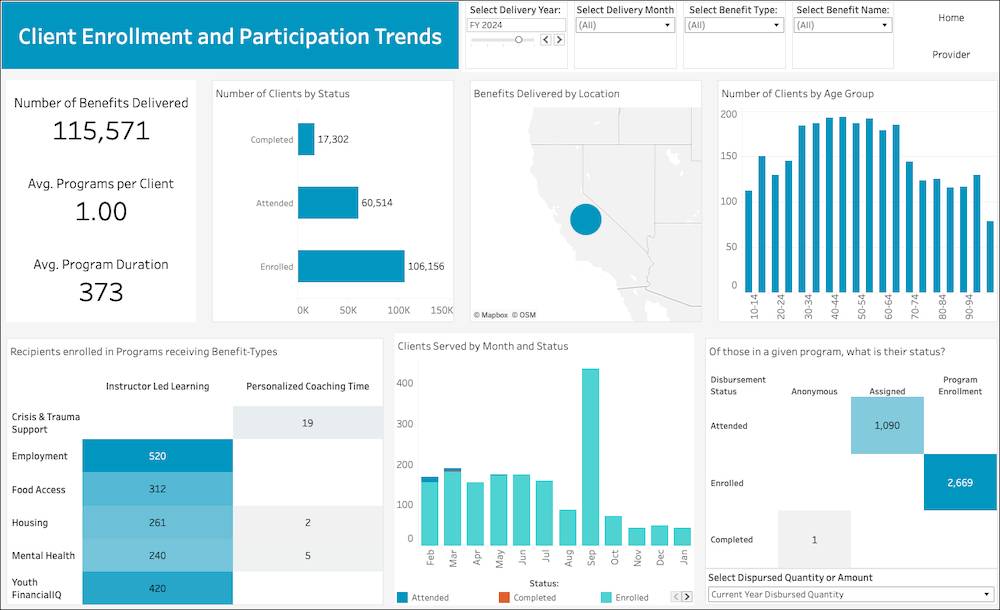
This Tableau Accelerator dashboard shows trends in client enrollment and participation. The staff at HNMI uses this dashboard to quickly identify patterns around service delivery, plan with better insight into staff capacity and client intake limitations, and use data to drive other decisions. The team also uses Tableau Pulse to monitor key programs in real time.
In addition, HNMI uses dashboards to share results with volunteers, donors, and institutional funders. The data tells the story of how the organization helped program participants. Donors can also view trends about changing needs in the community. This transparency gives data-hungry donors a view into how their gifts are making a difference, leading to more donations.
HNMI also recently used Tableau to examine data, discovering that more families are now food-insecure in one of the communities it serves. With historical data as evidence of the shift in need, the HNMI Program team approached its leadership about starting a pilot anti-hunger program. They shared a viz with the Fundraising team, who used it to secure funding for the program from donors and foundations.
As HNMI expands the program, it can monitor its impact in real time and quickly identify and act on opportunities to improve its efforts. It also can share real-time results with its leadership team, board members, and funders.
Track Grantmaking Awards and Results
Nonprofits that raise money and provide services aren’t the only organizations that can benefit from Tableau. Grantmakers also use Tableau to track grants awarded and tell the story of the impact they have on the community.
One of HNMI’s funders, for example, uses Tableau to track funding requests, grant stages, funds disbursed, and remaining balances. Tableau helps keep grants moving through the funding lifecycle while providing a way to collaborate on data and gain actionable insights for the next batch of grants.
The funder connected Agentforce Nonprofit to the Salesforce Nonprofit Cloud - Grantmaking Tableau Accelerator. Here’s one view from that dashboard.

The accelerator dashboard shows grants by performance measure, grantee performance, and the location of grant awards. Using this Accelerator, the funder can now view trends by program, state, and grantee over time. It has a handy profile in Tableau for each organization it funds—like HNMI—to track overall performance and the status of individual grant awards. Tableau Pulse helps the grantmaker see the latest trends in grants in real time.
Get Access to Tableau
To start using Tableau, you can sign up for a free trial through the Tableau website.
Many people use Tableau Desktop to analyze their data, though you can also do online analysis using Tableau Server or Tableau Cloud.
Tableau has many different products and prices to meet different organizations and different data needs. Check out the Resources section of this unit, and talk to your account executive for more information. Be sure to ask about nonprofit discounts.
Now that you understand some use cases for Tableau and how to get access, it’s time to dive into how to start. In the next unit, you learn about Tableau Accelerators for nonprofit organizations.
Resources
- Tableau Website: Business Intelligence and Analytics Software
- Tableau Foundation Website: Let’s Build a Better World with Data
- Tableau Website: Get Started with Tableau
- Trailhead: Tableau Basics
- Trailhead: Tableau Pulse: Quick Look
- Trailhead: Tableau Agent: Quick Look
- Trailhead: Tour the Tableau Environment