Explore Emissions Forecasting
Learning Objectives
After completing this unit, you’ll be able to:
- List the key factors that are used in forecasting.
- Explain how forecasts are calculated.
- Explain how forecasts are adjusted.
Looking Forward
Wouldn’t it be great if you could compare forecasts with the targets, and get insights into how far you are from achieving them? The forecasting capability of Agentforce Net Zero helps you do just that, and much more. Emissions forecasts might not be accurate, but they still give an idea of what a company’s emissions will be, and help to make proactive decisions in reducing emissions.
Key Factors Used in Forecasting
Before studying how emissions forecasts are calculated, Sam Rajan takes time to understand the underlying factors that are used in forecasting.
- Forecast dimensions
- Measures
- Period groups
- Account
Forecast dimensions: Forecasts are calculated for emissions activities, which are predefined in the Emissions Activity object. For a complete list of emissions activities, see Emissions Activities and Their Emissions Scope Categories.
Emissions activities have three logical levels.
- The lowest level of emissions activities has assets and activities that generate emissions, such as Scope 3 Business Travel.
- The mid level is the scope category to which a lowest level emissions activity belongs, such as Scope 3.
- The top level, All Emissions, represents the total emissions for the company.
Measures: Measures are a time-varying set of data points used in emissions forecasting, which are predefined in the Sample Emissions Forecast Set. Some measures are auto-calculated, while some need to be manually specified. Measures can belong to one of these logical categories.
- Business metrics
- Targets
- Actual emissions
- Forecasts
- Carbon credits
Business metrics that the forecast set supports are Revenue, Headcount, Total Floor Area (sqft), and Procurement Spend. Emissions forecasts for every emissions activity are based on an underlying business metric. For example, emissions forecasts for Scope 3 Business travel are based on how Revenue increases in future years. Sam must provide business metric values for the forecast years.
Target and actual emissions measures are auto-populated from the emissions reduction target and emissions inventory records, respectively, during forecasting.
Forecast measures contain forecasted calculations and user-editable measures that can be used to influence forecast calculations.
Carbon credit-related measures contain information that helps plan for the carbon credit requirements and investments in future years. The forecasting process uses the company-level net zero target to calculate the carbon offsets by comparing the target emissions with the forecasted emissions.
For a complete list of measures, see Emissions Activities and Their Emissions Scope Categories. To understand which underlying business metric is used to forecast which emissions activity, see Measure Types.
Period groups: Emissions forecasts are generated yearly for a period of 15 years in the future, by default. Also, historical data for the past 7 years, if available, is displayed. Sam can configure the default period, if necessary.
Account: The forecasting process needs a representative Account record. While the account isn’t used in any calculations, all forecast records are associated with the account. Sam ensures that an account is created for Northern Trail Outfitters (NTO).
Before You Forecast
Now that Sam understands the key factors, he notes the mandatory prerequisite tasks for forecasting.
- Create an account for NTO.
- Upload business metrics data. Sam can work with the admin to import this data. Alternatively, he can enter the data from the user interface (more on this later).
- Ensure actual emissions data for the previous year is available. Sam checks whether an emissions inventory record for the previous year exists. Actual emissions for the previous year for emissions activities are required to forecast future emissions.
Let’s Forecast
Three Data Processing Engine job templates that contain the predefined forecasting logic are available out of the box. Sam can work with the admin to run these template jobs, as required.
-
Initialize Emissions Forecasts: This job template is run to initialize emissions forecasting.
-
Calculate Emissions Forecasts: This job template retrieves actual emissions data for the previous year, target information, and the business metric values to calculate emissions forecasts for future years. It also calculates the required carbon credits to meet net zero targets.
-
Reinitialize Emissions Forecasts: This job template is run-only when there’s a change to the basic underlying forecasting data. For example, if Sam changes the forecasting period in the period group from 15 to 10 years.
Now that Sam is all geared up for forecasting, he works with the admin to run the Initialize Emissions Forecasts job template and then the Calculate Emissions Forecasts job template.
From the Advanced Account Forecast Set Partners page, Sam accesses the Advanced Account Forecast Set partner record that was automatically created when the Initialize Emissions Forecast job template was run.
The forecasting grid on the Advanced Forecast page displays emissions activities and a set of measures that belong to the selected measure group. Sam can create additional measure groups. For example, measures related to business travel can be grouped into a measure group. For more information, see Create Measure Groups.
The forecasting grid enables Sam to enter or modify the business metric values, and to provide values for the user-defined measures.
Sam is interested in viewing forecasts for Scope 3 Business Travel. He can easily filter the data on the grid for this emissions activity. He can choose to view specific measures by selecting an appropriate measure group.

While Sam knows what goes into the forecast calculations, he’s curious to understand how they’re actually computed.
Calculating Forecasts
Emissions forecasts are calculated for each emissions activity and then summarized by scope. Broadly, emissions forecasts per emissions activity are calculated in two stages.
First, emissions intensity is calculated for the previous year for which emissions data is available:
Actual Emissions Intensity = Actual Emissions (tCO₂e)/Business metric
Next, this intensity value is multiplied by the associated business metric values for the forecast years to generate their emissions.
To summarize, forecast calculations for an emissions activity for a year in future, say 2026, require:
- Actual emissions intensity
- Actual emissions for the emissions activity in the previous year (2021)
- Business metric value in the previous year (2021)
- Business metric value in the future year (2026)
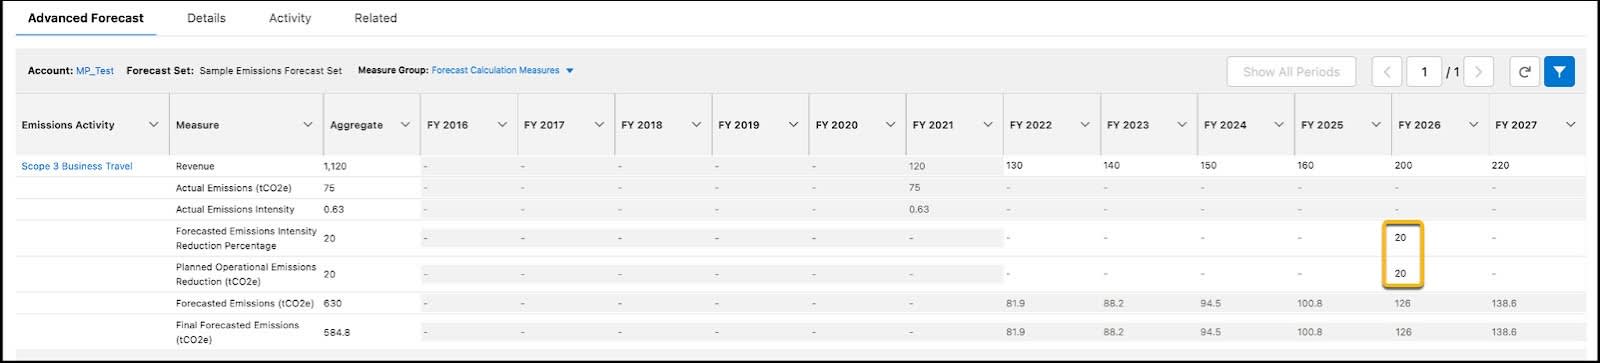
Let’s look at the intensity calculation and emissions forecasts using the example of Scope 3 Business Travel emissions activity and its associated business metric Revenue.
If Actual Emissions (tCO₂e) for previous year 2021 = 75
And Revenue for 2021 = 120
Then Actual Emissions Intensity for 2021 = 75/120 = 0.625, which is rounded off to 0.63
Now consider Revenue for 2026 = 200
Then Forecasted Emissions (tCO₂e) for 2026 = 200 * 0.63 = 126
Scope-level forecasts are an aggregation of the forecasts of the emissions activities within the scope. And emissions forecasts for All Emissions are an aggregation of the forecasts for scope 1, scope 2, and scope 3.
The forecasting process also calculates carbon credits that Sam can purchase in future to meet net zero targets. Carbon credits are predicted at the All Emissions level, which represents the overall emissions of the company. They are calculated as:
Carbon Credits = Final Forecasted Emissions - Target Compensated Emissions
Here, Target Compensated Emissions is retrieved from the emissions reduction target record that was created for net zero target.
Sam can get the required carbon credit investments for a year by providing the carbon credit cost. The forecasting feature automatically calculates the required carbon credit investments by multiplying the required carbon credits with the specified carbon credit cost.
Adjusting Forecasts
NTO plans to launch several emissions reduction initiatives. Sam can easily capture the impact of such initiatives and programs to ensure forecasts for the related emissions activity are reduced.
Let’s understand how Sam can influence the calculated forecasts for 2026 for the Scope 3 Business Travel emissions activity based on the emissions intensity reduction and planned operational emissions reduction values.
Sam provides these values.
- Forecasted Emissions Intensity Reduction Percentage:
20 - Planned Operational Emissions Reduction (tCO₂e):
20
Again, he works with the admin to rerun the Calculate Emissions Forecasts job template. After the job template run completes, the recalculated final emissions forecasts are derived as follows.
Final Forecasted Emissions (tCO₂e) = Forecasted Emissions (tCO₂e) * (1- Forecasted Emissions Intensity Reduction Percentage/100) ) - Planned Operational Emissions Reduction (tCO₂e)
= 126 * (1 - (20/100)) - 20 = 80.8
Sam reviews the updated forecasts on the forecasting grid.

Now that Sam understands how he can use the forecasting grid to make the necessary forecast adjustments, he works with the key stakeholders to identify emissions savings initiatives and efforts for different emissions activities. And as he updates the measures to reflect these initiatives, he periodically reruns the forecasting Data Processing Engine template jobs to review latest forecasts to get as close to the targets as possible. With forecasts that reflect NTO’s key emissions reduction initiatives, Sam can get a better understanding of where the emissions would be compared to targets in future years.
Gain Visual Insights Using the Climate Action Dashboard
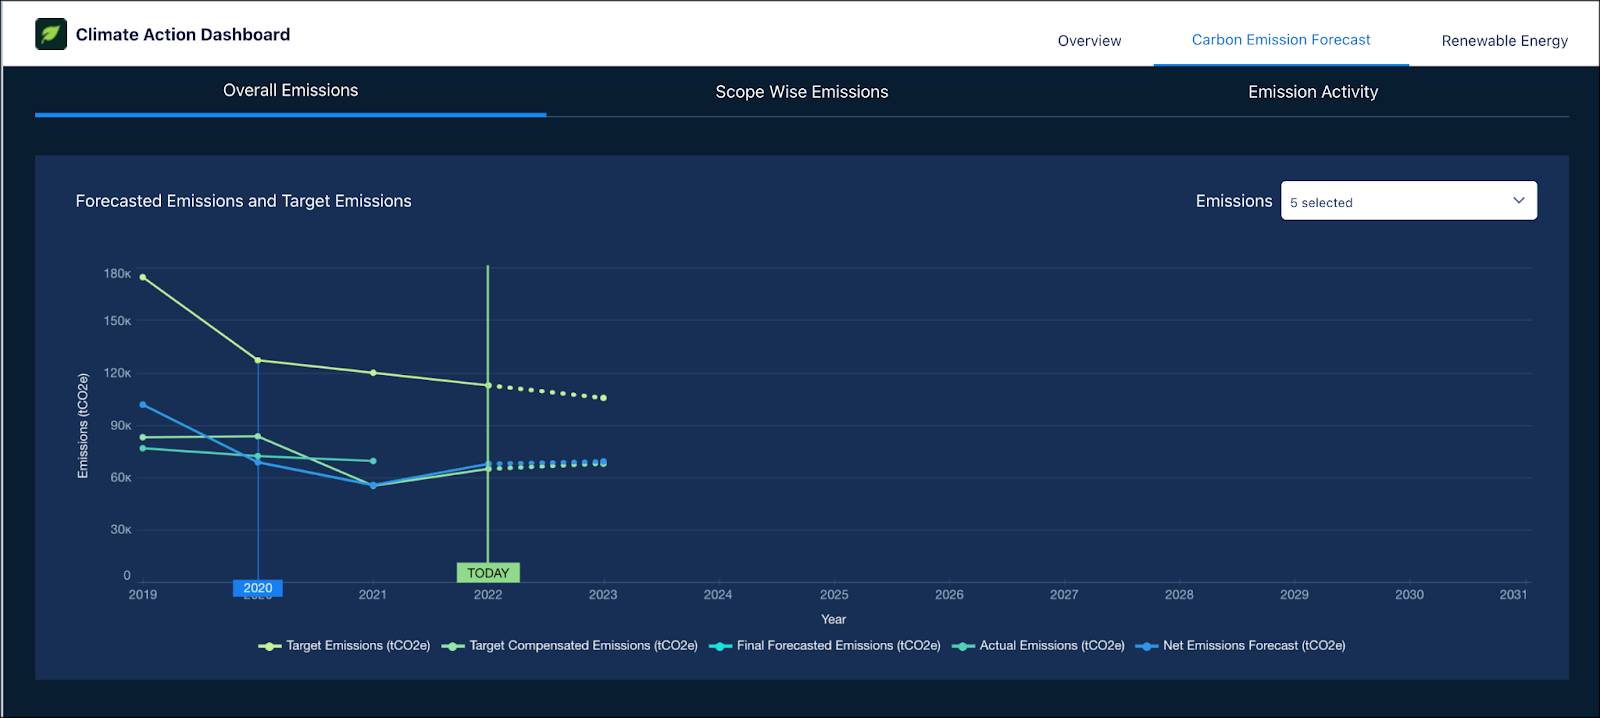
Sam can gain visual insights into the emissions data by using the Climate Action Dashboard, which is a predefined CRM Analytics dashboard.

The Carbon Emission Forecast tab of the Climate Action Dashboard provides a visual comparison of the forecasted versus target versus actual emissions data. Sam can choose to view the graph for the overall emissions, scope-wise emissions, or by emissions activity.
Wrapping Up
Agentforce Net Zero serves as a one-stop solution for tracking and managing NTO’s climate action commitments, carbon inventory, and science-based targets. Sam can use the forecasting capability to assist with the challenges in meeting his targets and planning the necessary mitigation actions. Following in his footsteps, you too can easily manage and track your targets and work toward meeting them to fulfill your climate commitments.
Resources
- Salesforce Help: Emissions Forecasting
- Salesforce Help: Learn About Advanced Account Forecasting in Agentforce Net Zero
- Salesforce Help: Create Measure Groups