View and Compare Org Performance Metrics with Scale Center
Learning Objectives
After completing this unit, you’ll be able to:
- View real-time performance metrics.
- Detect performance hotspots before and after you scale.
- Compare performance over different time periods.
Before You Start
To get the most out of this module, it helps to be familiar with the concept of scalability. Be sure to check out this recommended content.
Get a Comprehensive View of Your Org
Salesforce Scale Center revolutionizes the way teams approach development, testing, and monitoring by providing self-serve and near real-time access to org performance metrics and actionable insights.
Whether you’re a performance engineer, architect, developer, or admin, Scale Center helps you proactively assess and resolve performance issues. Here are some key things Scale Center allows you to do.
- Get real-time access to org performance and scale metrics.
-
Self-serve and run detailed investigations to find the root cause and debug scale issues.
- Proactively access scale metrics and validate performance test results.
-
Shift left and prevent bad code from being deployed in production.
Understand the Power of Scale
Scaling efficiently is a critical aspect of designing and implementing applications on the Salesforce Platform. And you may only become aware of scalability issues when your end users start reporting degraded performance and usability.
Your organization could reach a critical tipping point in which your system can no longer scale up and handle unexpected events. And that means spending time and money troubleshooting, redesigning, and refactoring.
These scalability issues also compound over time and create performance issues. That could lead your business to spend development and maintenance resources solving these issues rather than working on new features that create value for your customers.
Designing for the future and predicting and simulating future business traffic can also be challenging. While some errors can be caught during the design phase, most errors occur only at runtime in production and sometimes they manifest during peak loads. Scale Center lets you isolate and deep dive into these hot spots.
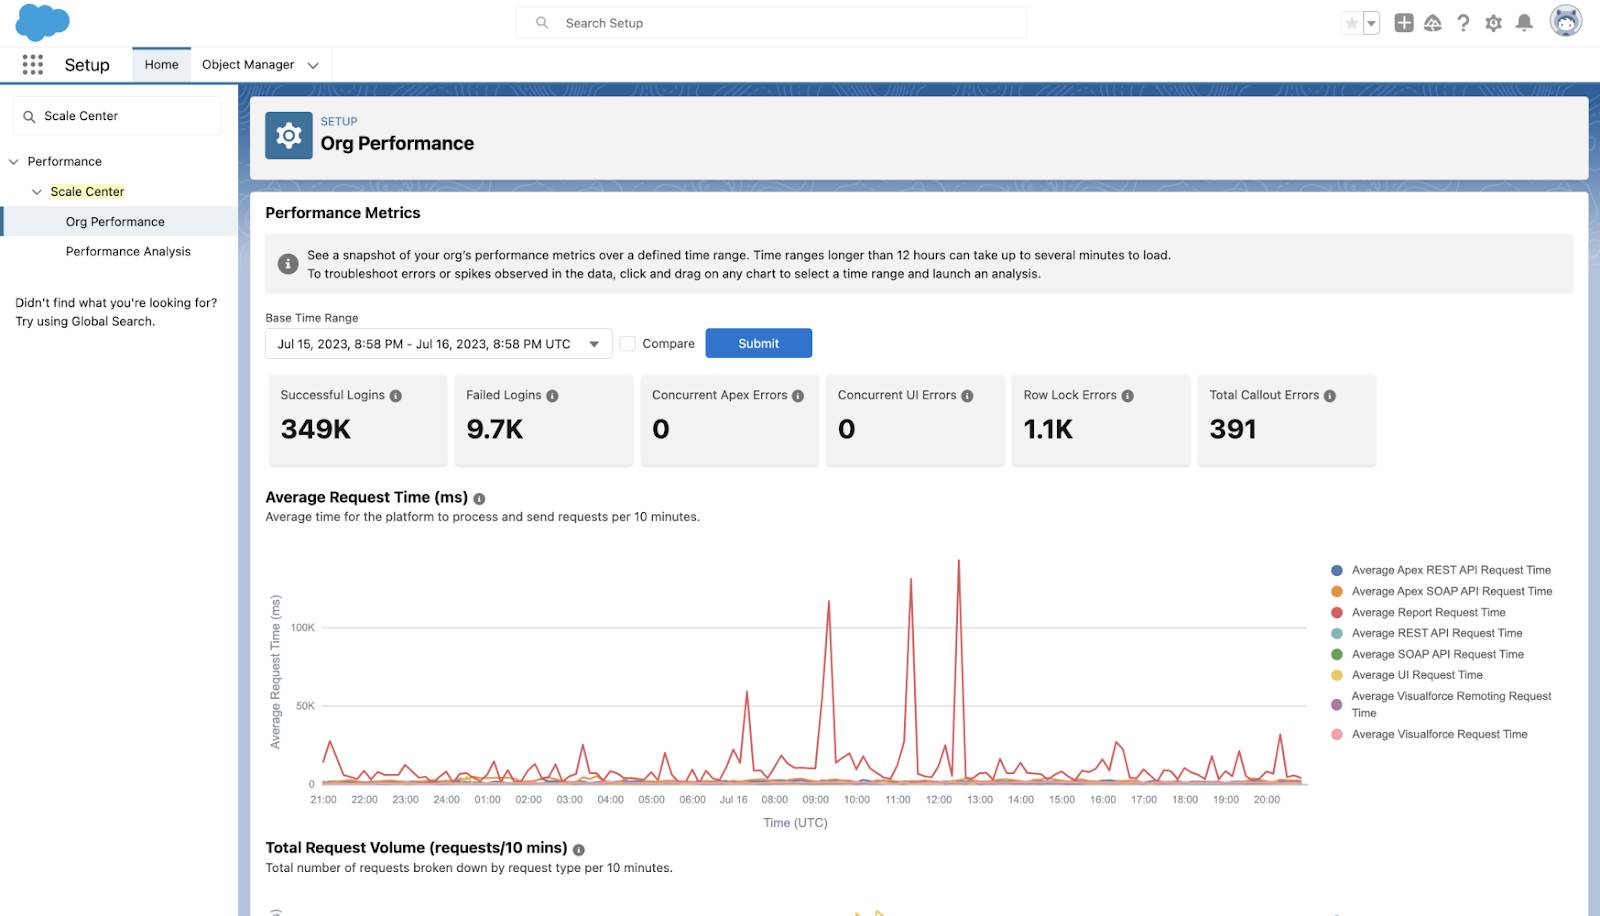
View Org Performance Metrics
Scale Center gives you a snapshot of org performance metrics over a defined time range. You see a single view into Failed Logins, Concurrent Apex Errors, Concurrent UI Errors, Row Lock Errors, and Total Callout Errors.
You can also see charts showing Average Request Time, Total Request Volume, Total App CPU Time, Total Database CPU Time, Total Logins, and Total Errors. The Average Callout Time shows you the time required by the platform to perform the callout to an external endpoint.
You can click individual metrics in the chart legend and toggle each one to isolate them for a clearer view. Or you can click and drag part of the chart to start an analysis report.
Compare Two Time Windows
Scale Center also allows you to compare org performance metrics over two different time windows. Click the Compare checkbox on the Org Performance page before creating your report.
Here are three examples of ways this can be helpful.
- Prepare for production deployment.
- Conduct performance testing in a sandbox environment.
- Analyze the test results in Scale Center to identify any bottlenecks or performance issues before deploying to production.
2. Assess post-deployment impact.
- After a major release or feature deployment in production, use Scale Center to compare org metrics before and after the deployment.
- Determine if the deployment has had any detrimental impact on the overall performance of the organization.
3. Analyze performance during peak days.
- Use Scale Center’s comparison feature to assess the impact on org performance during peak days.
- Compare traffic and performance metrics to baseline behavior, helping to identify any changes or potential issues.
Analyze Performance Reports
On the Performance Analysis page, Scale Center lets you start a new analysis report or see up to 100 reports you already created here or from the Org Performance page.
From the Performance Analysis page, you can generate a report that displays the Analysis Type, person who requested the report, date, and time.
When you open the report, you see an overview with a breakdown of top SOQL Queries by DB CPU time, a log of record type activity, top entry points, and the users ranked by DB CPU time.

Each available analysis type has its own icon, chart, pie chart, and column. These are the available types.
- Consolidated Report
- Apex Summary
- Concurrent Apex
- Database Performance
- Flow Performance
- Governor Limits
- List Views and Reports
- Integrations Performance
- Row Lock
Get Started with Scale Center
Scale Center is free to use and accessible in all Unlimited Edition (UE) production and full-copy sandbox orgs.
Here are the product considerations.
- Scale Center has no impact on org performance and doesn’t access your org data.
- Scale Center isn’t supported in Government Cloud Plus.
- If you’d like Scale Center enabled in a non-UE org, reach out to your account representative.
- Scale Center isn’t supported in Developer, Developer Pro, and Partial-Copy sandboxes.
Ready to get started? Here’s how to access Scale Center.
- Navigate to Setup.
- In the Quick Find box, enter
Scale Center, and then select Scale Center.
- To enable Scale Center for your org, turn on Enable Scale Center. Performance metrics take about 2 hours to appear.
Resources
- Salesforce Help: Scale Center
- Developers’ Blog: Salesforce Scale Center is Generally Available
- Salesforce Architects: Well-Architected Framework
- Trailhead: Scalability with Salesforce