Evaluate Campaign and Promotion Source Codes
Learning Objectives
After completing this unit, you’ll be able to:
- Describe how source codes are used with campaigns and promotions.
- List the reasons to use the Source Codes dashboard.
- Define the Source Code dashboard metrics.
- Explain how Source Code dashboard metrics highlight promotion performance.
- Explain how to apply the Source Code dashboard metrics to a use case.
Explore the Source Code Dashboard
A source code activation happens when a customer clicks a link that contains a source code. The B2C Commerce Source Code Dashboard gives you a view of source code conversion activity, as well as orders and revenue metrics linked to source code activations.
You can use the dashboard reports to track source code performance by:
- Source code activations
- Orders placed from source code activations
- Source code conversion rates
- Revenue generated by source codes
You can also use the dashboard results to finetune your source code placements. For example, you can identify the most popular source codes, and increase their use with affiliate sites. In addition, you can identify the inactive source codes that are still available on affiliate sites and have them taken down.
Source Codes as Promotions Qualifiers
Source codes can act as promotion qualifiers. For example, you can expose your shoppers to promotion source codes with marketing emails, online ads, or links on affiliate sites. When shoppers click those promotional source code links, the source code in the URL qualifies them for the source code promotion.
Source Code Groups
Individual source codes are aligned with a source-code group. Source-code groups contain one or more source codes that are handled by the storefront in a common way. For example, you can map multiple codes to the same set of rules (promotions, price books, content, and redirects). See the Salesforce B2C Commerce Campaigns and Promotions Trailhead module for more details.
What Are the Source Code Dashboard Metrics?
The Source Code dashboard reports on three classifications of source codes: active, inactive, and invalid. You can use the dashboard’s reports and metrics to compare active source code conversion results against your expected promotion campaign performance goals. You can also use it to inventory your source codes by identifying inactive source codes still in use. The Source Code dashboard has four reports and graphs.
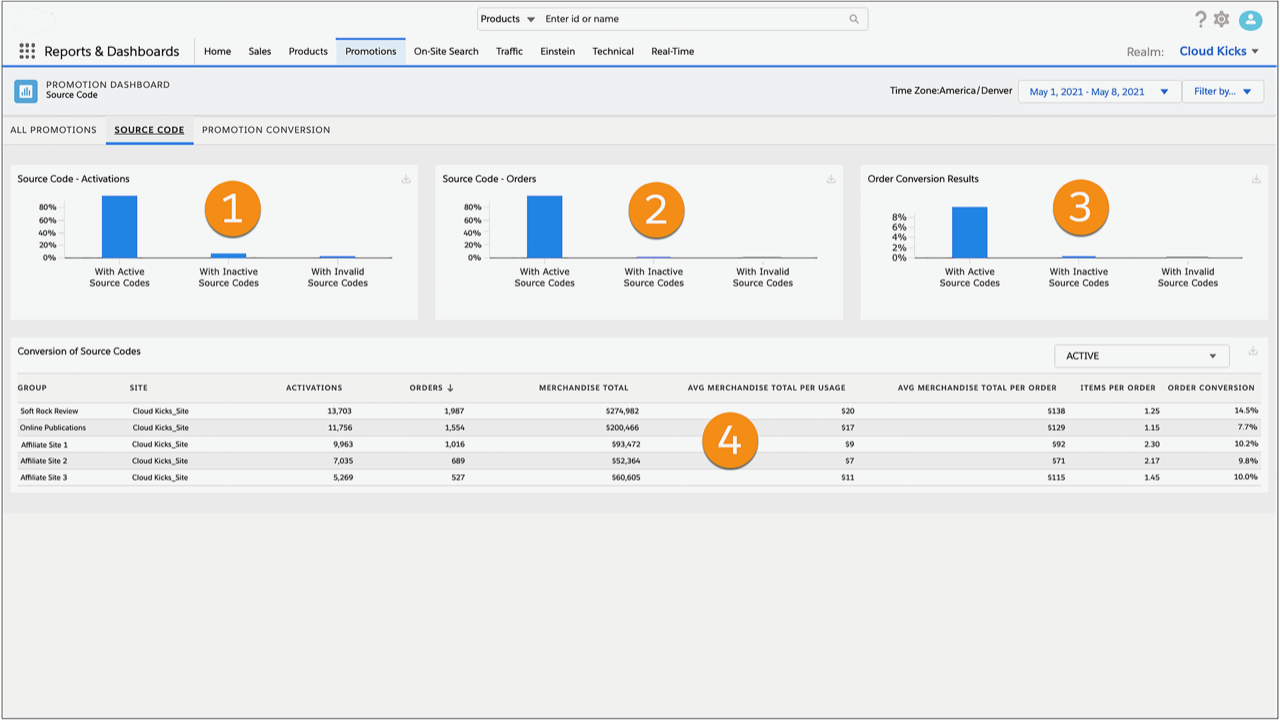
Table or Graph |
Description |
|---|---|
Source Code Activations (1) |
This bar graph compares the percentage of source code activations by source code classification (active, inactive, and invalid). To see the percentage of activations for a classification, and the associated average revenue per activation, roll over the bar that represents the classification. |
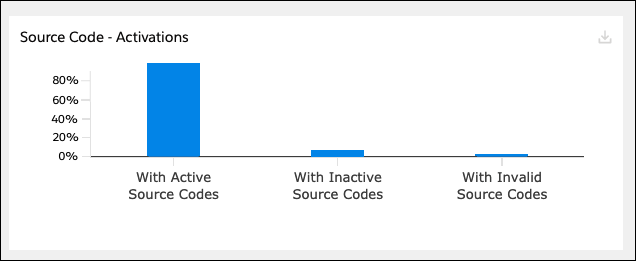
Source Code Orders (2) |
To see the percentage of orders placed from a classification, and the average revenue per order for the classification, roll over the bar that represents the classification. Use the graph to review the classification of source code activations from which orders are placed. Typically, you expect to see a high percentage of orders placed from active source codes. |
Order Conversion Results (3) |
This bar graph compares the source code conversion rate for each source code classification (active, inactive, and invalid). The conversion rate is calculated as Orders/Total Activations. To see the conversion rate and the revenue per order for a source code classification, roll over the bar that represents the classification. Use the graph to assess the success of your source codes as promotion qualifiers. Take note of inactive and invalid conversions. If the conversion rates are significant, dig deeper into their source. You can reactivate them and take advantage of their popularity. |
Conversion of Source Codes (4) |
This table ranks the top five source code groups by conversion rate. The table includes the following source code conversion details.
Use the dropdown to configure the table to display conversion details for active, inactive, or invalid source codes. Because inactive and invalid source codes do not activate a promotion, conversion and orders generated from them are not typical. However, if the storefront is accessed via a URL containing an inactive or invalid source code, orders may still be generated. When this happens, the activation is classified as inactive or invalid. If the source code exists within Business Manager but is not live, the source code is inactive. If the source code doesn’t exist in Business Manager, it’s classified as invalid. |
 This bar graph compares the percentage of orders placed from source code activations by source code classification (active, inactive, and invalid).


This table describes the Source Code dashboard metrics.
Metric |
Description |
|---|---|
Activations |
The number of times the source code group was activated A source code group is activated when the site is accessed using a source code from that group. |
Orders |
The number of orders created with this source code group
|
Merchandise Total |
The merchandise value from orders created with this source code group
|
Average Merchandise Total per Usage |
The average merchandise value per source code activation, calculated as: Merchandise Total / Activations
|
Average Merchandise Total per Order |
The average merchandise value per source code order, calculated as: Merchandise Total / Orders
|
Items Per order |
The average number of items per source code order
|
Order conversion |
The conversion rate of the source code group, calculated as: Orders / Activations
|
Active Source Code |
A source code enabled and scheduled (live) at the time of the activation |
Inactive Source Code |
A source code that was disabled or not scheduled (not live) at the time of the activation |
Invalid Source Code |
A source code that was referenced in the source code parameter of the URL but does not exist in Business Manager
|
Evaluate Source Code Metrics
If you completed the previous units, you know that Brandon Wilson, Cloud Kicks senior merchandising manager, is running the Happy Trails Soft Rock trail-runner promotion campaign.

He’s using the promotions dashboards in the Reports & Dashboards tool to analyze the performance of the campaign’s promotions. After an initial assessment using the All Promotions and Promotions Detail dashboards, he determined that the campaign required a wider appeal to running and hiking enthusiasts. To engage that market segment, he added two new promotions that use source codes as qualifiers.
-
Soft Rock Review: Activates a 15% discount on orders of one or more pairs of Soft Rock Trail-Runners. The source code link is embedded in a product review on an online publication popular with running and hiking enthusiasts.
-
Online Publications: Activates a 15% discount on orders of one or more pairs of Soft Rock Trail-Runners for shoppers who frequent hiking and trail running publication websites. The source code is embedded in a Cloud Kicks ad placed on the affiliate sites.
The new promotions have been running for a few weeks, and Brandon is ready to check on their performance. For the review, he can use the Source Code dashboard.
Launch the Source Code Dashboard
Brandon launches the Promotions Source Code dashboard, and sets the date to match the current duration of the Happy Trails source code promotion period.

Review Dashboard Metrics
Brandon reviews the dashboard, and focuses on the following graphs and metrics.

-
Source Code Activations graph: Brandon sees that 95% of activations are with active source codes, 4% are with inactive source codes, and 1% are with invalid source codes (1). Cloud Kicks runs several source code promotions concurrently, and Brandon is pleased to see that the overwhelming majority of activations are from active source code groups.
-
Source Code Orders graph: He notices the average merchandise per order for active codes is $109. That’s in line with Cloud Kicks’s historical order data–99% of source code orders are from active source codes. The active source code rate indicates that his team is actively managing their inactive source codes.
-
Inactive Source Codes: He notices that a small percentage of orders is from inactive source codes (2). Brandon wants to know what the inactive source codes are, and what their associated order performance shows. Later, he can use the Conversion of Source Code table to review those metrics.
-
The Order Conversion Results graph: He sees that the active source code conversion rate is 10.5% (3). The rate is higher than the Cloud Clicks average. With these numbers, Brandon concludes that the source code promotions are performing well.
-
The Conversion of Source Codes table: He sees that the two Happy Trails source code groups rank first and second in orders (4). Brandon is excited to see the conversion rate on the 15% Soft Rock Review source code is a whopping 14.5%, with 4,678 orders. That’s an excellent conversion rate. He’ll share the success with marketing and have them develop other options to offer the Soft Rock Review source code link to shoppers.

Earlier, Brandon noticed that a small percentage of orders is from inactive source codes. To review conversion metrics for invalid source codes, he selects Inactive from the table dropdown (1).
The table lists four inactive source codes that show activation (2). Although the four inactive source code groups are showing orders and revenue, the orders are not generated from active promotions and don’t give customers the expected experience. Leaving inactive source codes available to shoppers is definitely not a best practice.
Brandon’s team can work with the affiliate to remove the inactive source code URLs from the affiliate site.
Brandon is pleased with the performance results of the source codes for the two new promotions. As a result of the source code performance, he makes plans with the marketing team to distribute the Soft Rock Review source code promotion through other publications. He also makes plans to place the Online Publications ad on other hiking and running enthusiast sites.
Next Steps
In this unit, you learned that the Promotions Source Code dashboard is where you can review how your source codes are generating orders and revenue. You learned how to read the dashboard’s source code graphs and how to use the Conversion of Source Code table to track performance of individual source code groups. Next you learn how to use the Promotion Conversion dashboard to analyze the conversion rates of a campaign.
References
Quiz Scenario
Based on the success of the two Happy Trails source code promotions, Brandon’s team created two new source code qualifier promotions for the Happy Trails promotions campaign.