Configure Your System and Build a Dashboard
Learning Objectives
After completing this unit, you’ll be able to:
- Customize values in the Activity Type picklist field.
- Build key activity and win rate reports.
- Add new reports to a dashboard.
Determine Task Types
Now it’s time to analyze key activities that your sales reps are doing to close deals. First we need to give them a place to record everything they’re doing as part of the sales process.
We recommend customizing the Type picklist field on the activity object so that users can easily categorize the different tasks they do during the sales cycle. By default, this field includes some generic values: Call, Meeting, Email, and Other. While those four values can be enough for your organization, your sales reps can be doing other types of activities to close deals. These include product demonstrations, presentations to prospects, site visits, or project estimates.
We suggest you meet with some sales reps or managers to identify categories that work for your organization. Keep it reasonable and settle on 5 to 10 key categories that capture the most common task types. Nobody likes massive picklists, especially busy salespeople. Keep the 80/20 rule in mind as you work with your team to come up with the activity types you want to implement in Salesforce.
Configure Activity Type Picklist
Once you’ve determined the activity categories that are right for your business, it’s time to configure the Activity Type picklist field in Salesforce. Here’s how.
- Click
 and select Setup.
- Click the Object Manager tab.
- Type task in the Quick Find box, and then select Task in the table.
- Click Fields & Relationships.
- Enter type in the Quick Find box, and then select Type in the table.
- Click New.
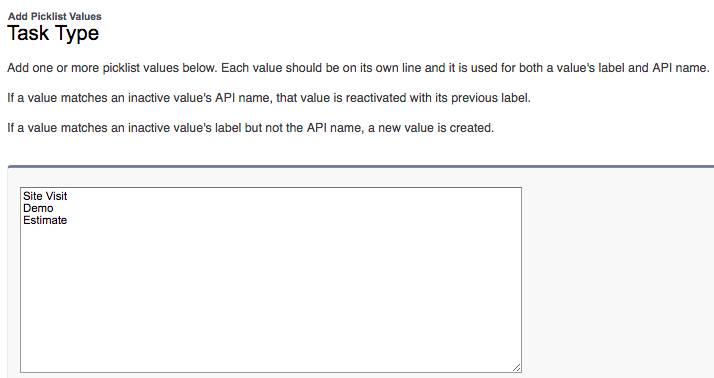
- Add your new values in the text box with each entry on a separate line.
- Click Save.
Create a Key Activity Report
Now that the Activity Type picklist has been customized to your sales process, let’s build a report that breaks down the types of activities that the sales reps have logged against the deals they’ve won.

- Click
 and select the Sales app.
- Click Reports in the navigation bar.
- Click New Report.
- Enter activities with opportunities in the text box, and select Activities with Opportunities in the report type selection popup.
- Click Start Report.
- After the report preview loads, click Filters.
- Click Show Me and then select All Activities in the picklist. Click Done.
- Click Date and select Close Date and click Apply.
- Next enter an appropriate range for the report data. We’re using Current and Previous FQ in our example, but you might need to experiment to find the right time range for your implementation. Click Apply.
- Click Show and then select Open & Completed Activities. Click Apply.
- Click Add Filter and then type stage in the text box. Select the Opportunity Stage field.
- Select Closed Won from the list of values and then click Apply.
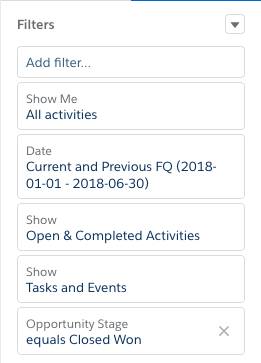
- Your filters should now look like this.
- Click Outline.
- Click Add Group and then type assigned into the text box. Select Assigned.
- Add another row grouping by clicking in Add group… and entering type into the text box. Select Type.
- Deselect the toggle-selectors at the bottom for Detail Rows, Subtotals, and Grand Total.
- Click Add Chart located at the top.
- Click
 to bring up the chart properties.
- Click Stacked Column.
- Click Run.
- If you are not seeing any results in your report, it can be because there are no activities that meet the filter criteria. Locate an opportunity with a Closed Won stage, create a new task from the opportunity detail page, and then re-run the report.
- If the report looks good, click Save.
- Name the report Key Activities Report and select a location to store the new report that your sales users can access.
Create a Win Rate Report
In this second report, you will learn how to calculate each sales reps’ percentage of won opportunities. Then you can see who is really efficient at scoring deals.
- Click Reports in the navigation bar.
- Click New Report.
- Type opportunities in the text box, and then click Opportunities in the report type popup.
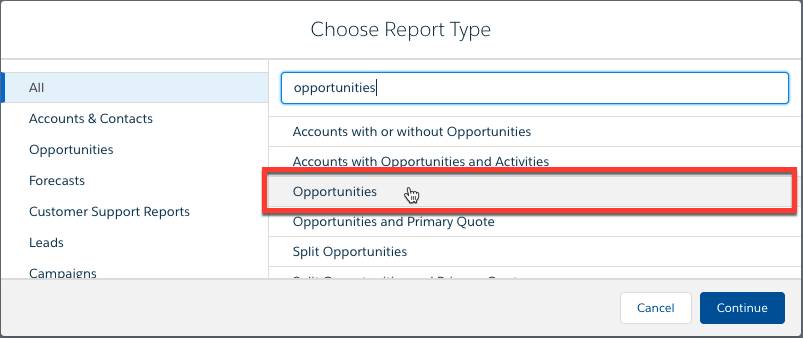
- Click Start Report.
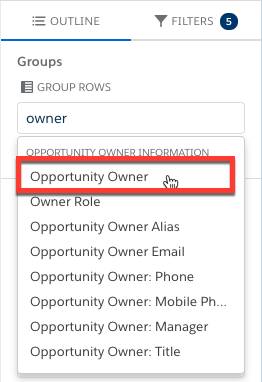
- When the report preview loads, click Outline.
- Type owner in the text box underneath Group Rows, and select Opportunity Owner.
- Click Filters.
- Click Show Me and select All opportunities.
- Click Close Date and select a suitable time range. Recommended: Current and Previous CQ to start with. Click Apply.
- Click Opportunity Status and select Closed in the opportunity status picklist. Click Apply.
- Click Outline, then click
 next to Columns, and select Add Summary Formula Column.
- Enter Win Rate in the Column Name text box.
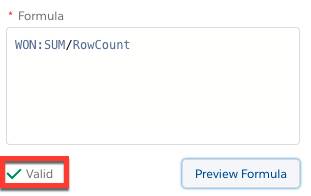
- Copy and paste the following into the Formula text box: WON:SUM/RowCount
- Click Check Syntax. If all goes well, the Check Syntax button is replaced with a green check box and the word Valid, like this graphic shows.
- Click Format.
- Select Percent in the Format As picklist, and select 1 for Decimal Points.
- Ensure All Summary Levels is selected, then click Apply.
- Click Add Chart.
- Click
 to bring up the chart properties.
- For Display As, select Column.
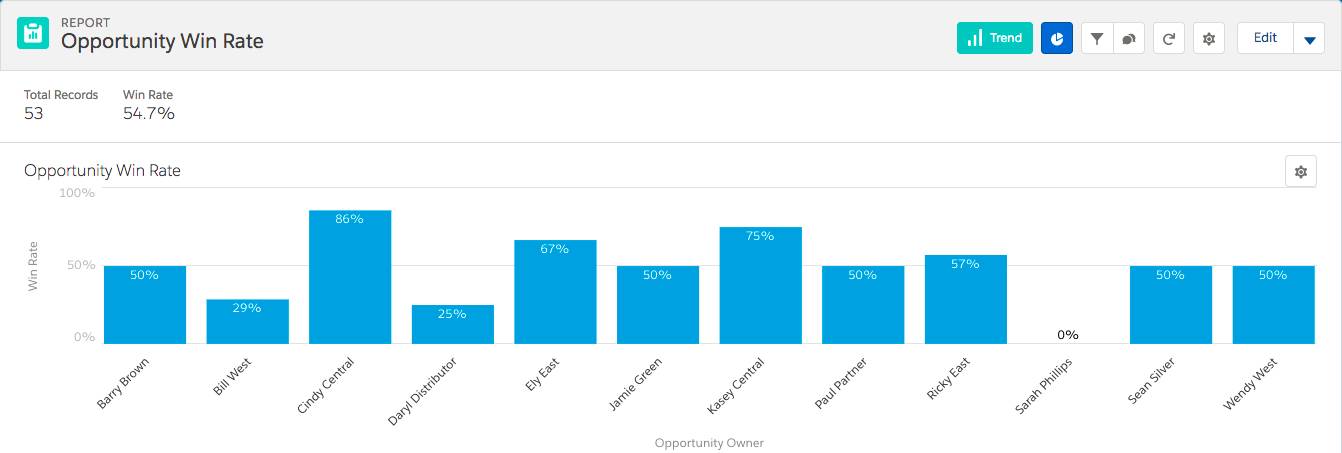
- Enter Opportunity Win Rate for Chart Title.
- Select Win Rate for the Y-Axis value.
- Click Run to see the full results.
- If the report looks good, click Save.
- Name the report Opportunity Win Rate and save it in an appropriate folder. We recommend selecting a folder that your sales team can access.
Build a Dashboard
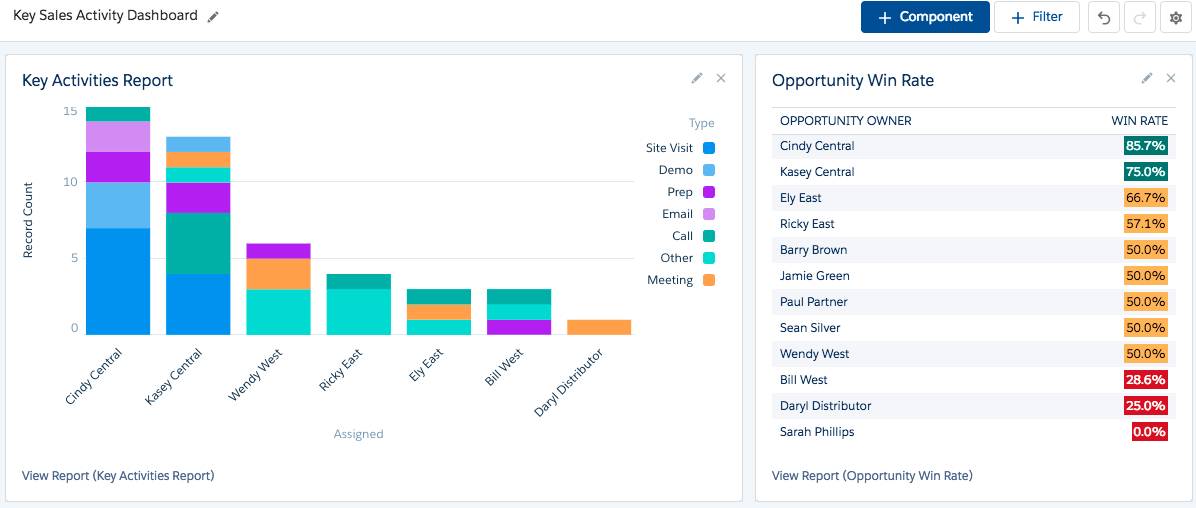
These two new reports by themselves are good, but viewing them side by side can really uncover some insights about your top-performing sales reps. Here’s how to build one. In our example we are starting with a new dashboard, but you can easily add these two new components to existing dashboards for your sales team.
- Click the Dashboards tab on the navigation bar.
- Click New Dashboard.
- Name the dashboard Key Sales Activity Dashboard and save in a folder that your sales users have access to.
- Click Create.
- Click +Widget and then select Chart or Table.
- Select the Key Activities Report you created previously.
- Select the stacked bar chart type, and then click Add.
- Click +Widget and then select Chart or Table.
- Select the Opportunity Win Rate report you created previously.
- For Display As, select the Lightning table type.
- Enter Opportunity Owner in the Groups text box and select Opportunity Owner.
- Enter Win Rate in the Measure Column text box and select Win Rate.
- Click the eye on the Record Count.
- Select Add Conditional Highlighting checkbox and enter appropriate break points for your organization. In our example, we’ve entered 50 and 75 for the segment ranges.
- Click Add.
- Use the handles on the new dashboard elements to resize and arrange the items in a visually appealing way.
- If everything looks good, click Save. Then click Done.
Resources
Add or Edit Picklist Values—Salesforce Help Article
Build a Report in Lightning Experience—Salesforce Help Article
Build a Lightning Experience Dashboard—Salesforce Help Article