Set Up Pipeline Inspection
Learning Objectives
After completing this unit, you’ll be able to:
- Understand how to set up historical trends for Pipeline Inspection.
- Understand how to set up metrics for Pipeline Inspection.
- Understand why to set up cumulative or single rollups.
- Describe Einstein features in Revenue Intelligence and CRM Analytics.
Now that you’ve set up the appropriate permission sets, you’re ready to continue with your plan of action by setting up Pipeline Inspection.
First, give Laura visibility on how opportunities move between forecast calls to help her figure out which opportunities need resources with Pipeline Inspection.
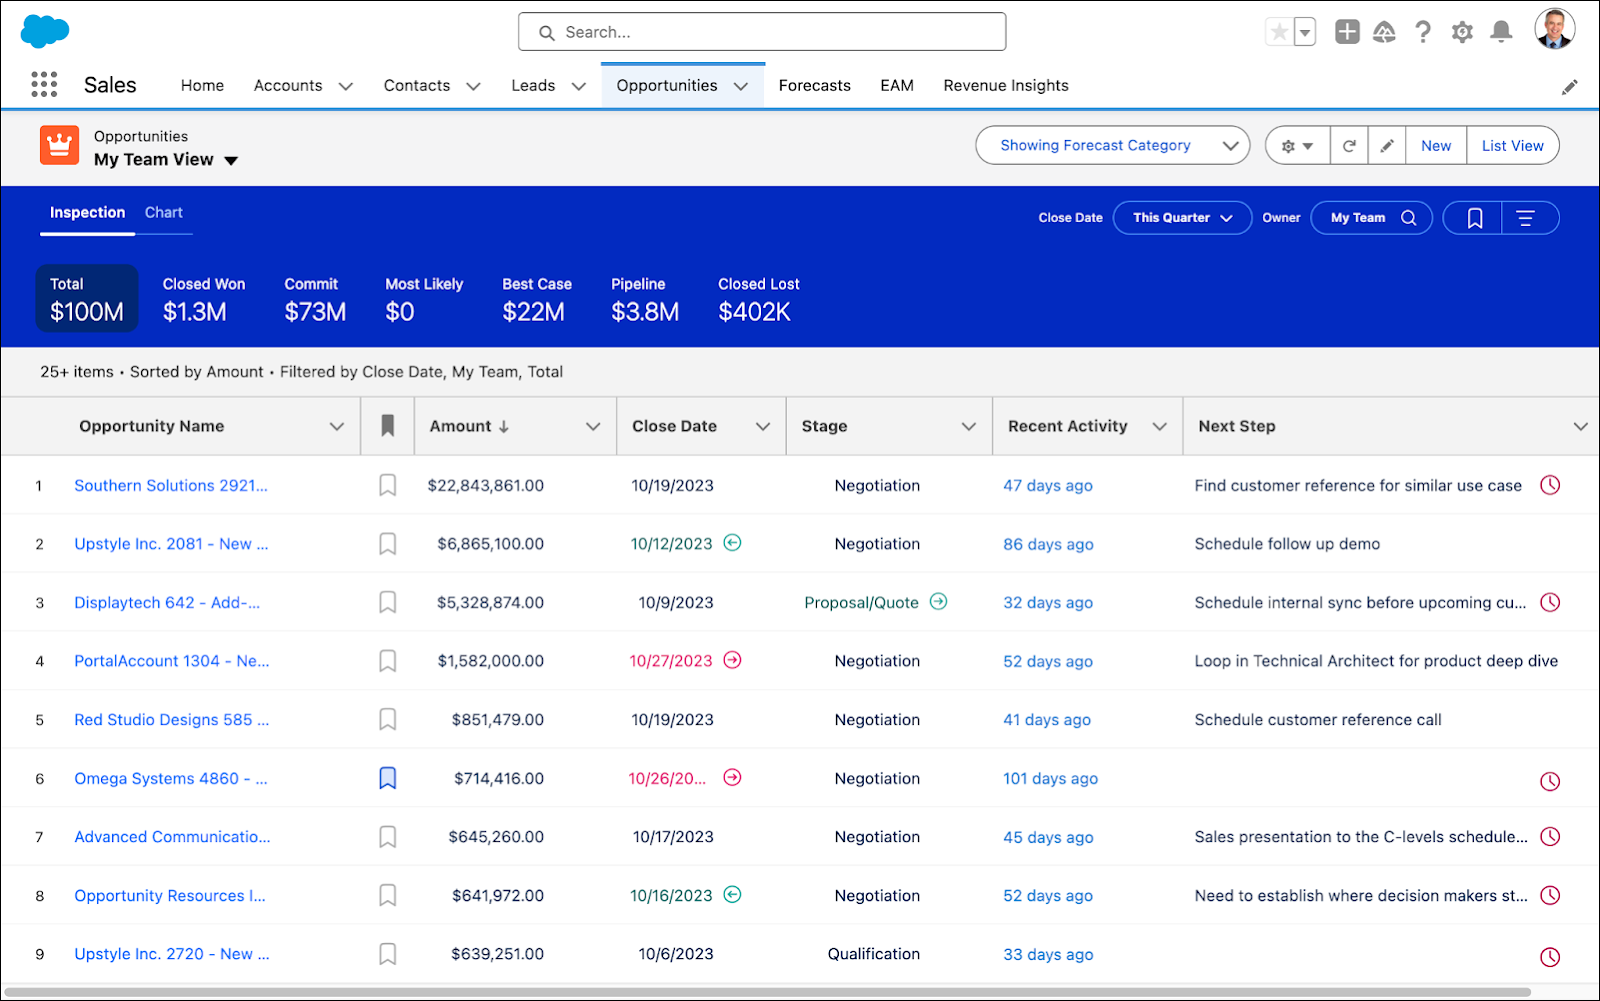
Pipeline Inspection is like the Opportunities list view with superpowers. It’s similar to a list view but enhanced with pipeline metrics, insights, and charts that don’t exist in standard opportunity list views. Laura hopes that her managers and sales reps make it the go-to place to manage their pipelines.
If your org is newer than Summer ’23, Pipeline Inspection may be enabled. You can follow these steps to decide if you want to change any default settings.
When you set up Pipeline Inspection, you must:
- Enable Pipeline Inspection.
- Make the Pipeline Inspection button visible on the opportunities page.
- Set up historical trending for opportunity items.
- Set up metrics for pipeline Inspection.
Enable Pipeline Inspection and Verify Historical Trending for Opportunity Item
Pipeline Inspection can show where opportunities were moved in or out, where amounts and close dates changed, and changes in stage and forecast category. It does this by annotating the Amount, Close Date, Forecast Category, and Stage fields with colors and icons and providing more information when hovering over these fields.
To do this, Pipeline Inspection uses historical trending on the opportunities object. Setting up historical trending also means that Get Cloudy sales managers can see similar changes in the Revenue Insights view.
You get to work enabling Pipeline Inspection and verifying that historical trending is enabled for the opportunity object fields Laura needs.
- From Setup | Pipeline Inspection Setup, click Turn on Pipeline Inspection.
- Click View historical trending settings and confirm that the opportunity object is in the Historical Trending list. If you want to trend any additional fields (like a custom amount field), do that here.
Make the Pipeline Inspection Button Visible on the Opportunities Page
Laura and her team can access Pipeline Inspection with a button you add to the Opportunity list view page. You can add the button from the Pipeline Inspection Setup page. The page shows one more step after adding the button: Give Users Access to Pipeline Inspection. As you have assigned Revenue Intelligence permission sets to your users, you can skip this step.
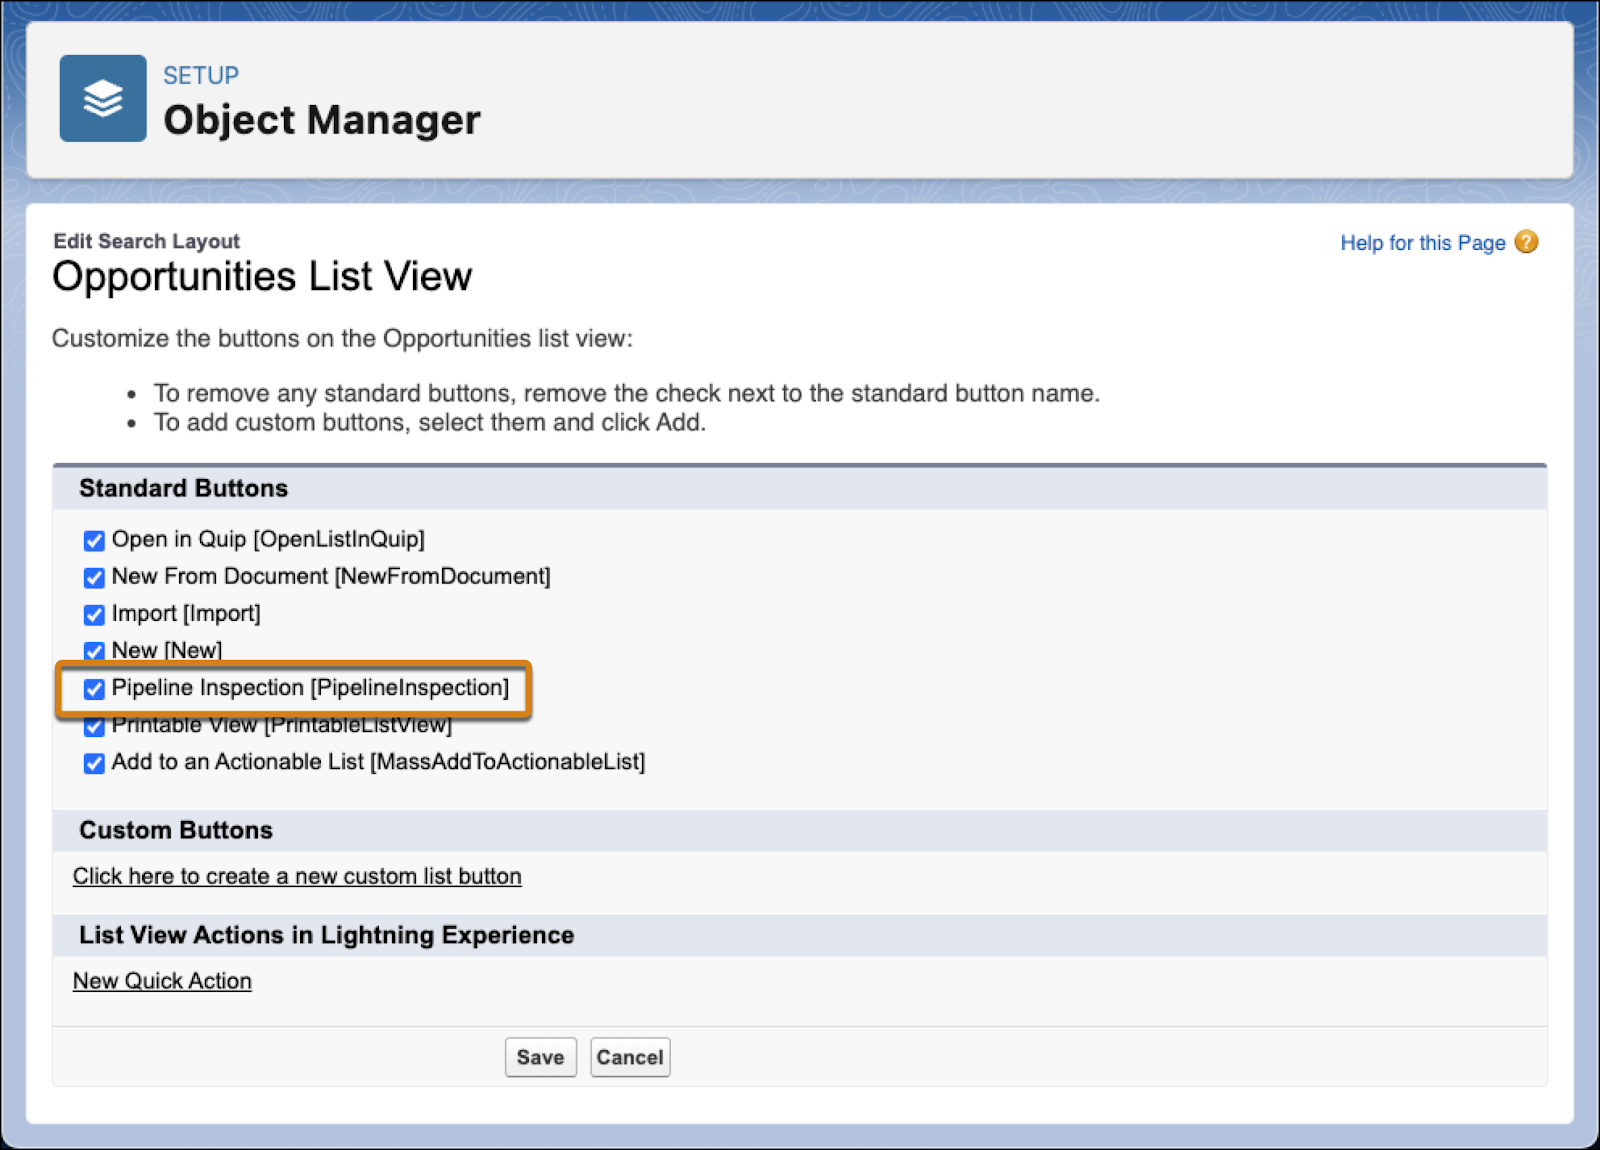
- To add the button: From the Pipeline Inspection Setup page, click Add Button.
- Click Save on the next page that shows Pipeline Inspection added as a standard button on the Opportunities List View.
- To see that the Pipeline Inspection button is on the Opportunities tab, go to the app launcher.
- Select the Sales app, and then the Opportunities tab.
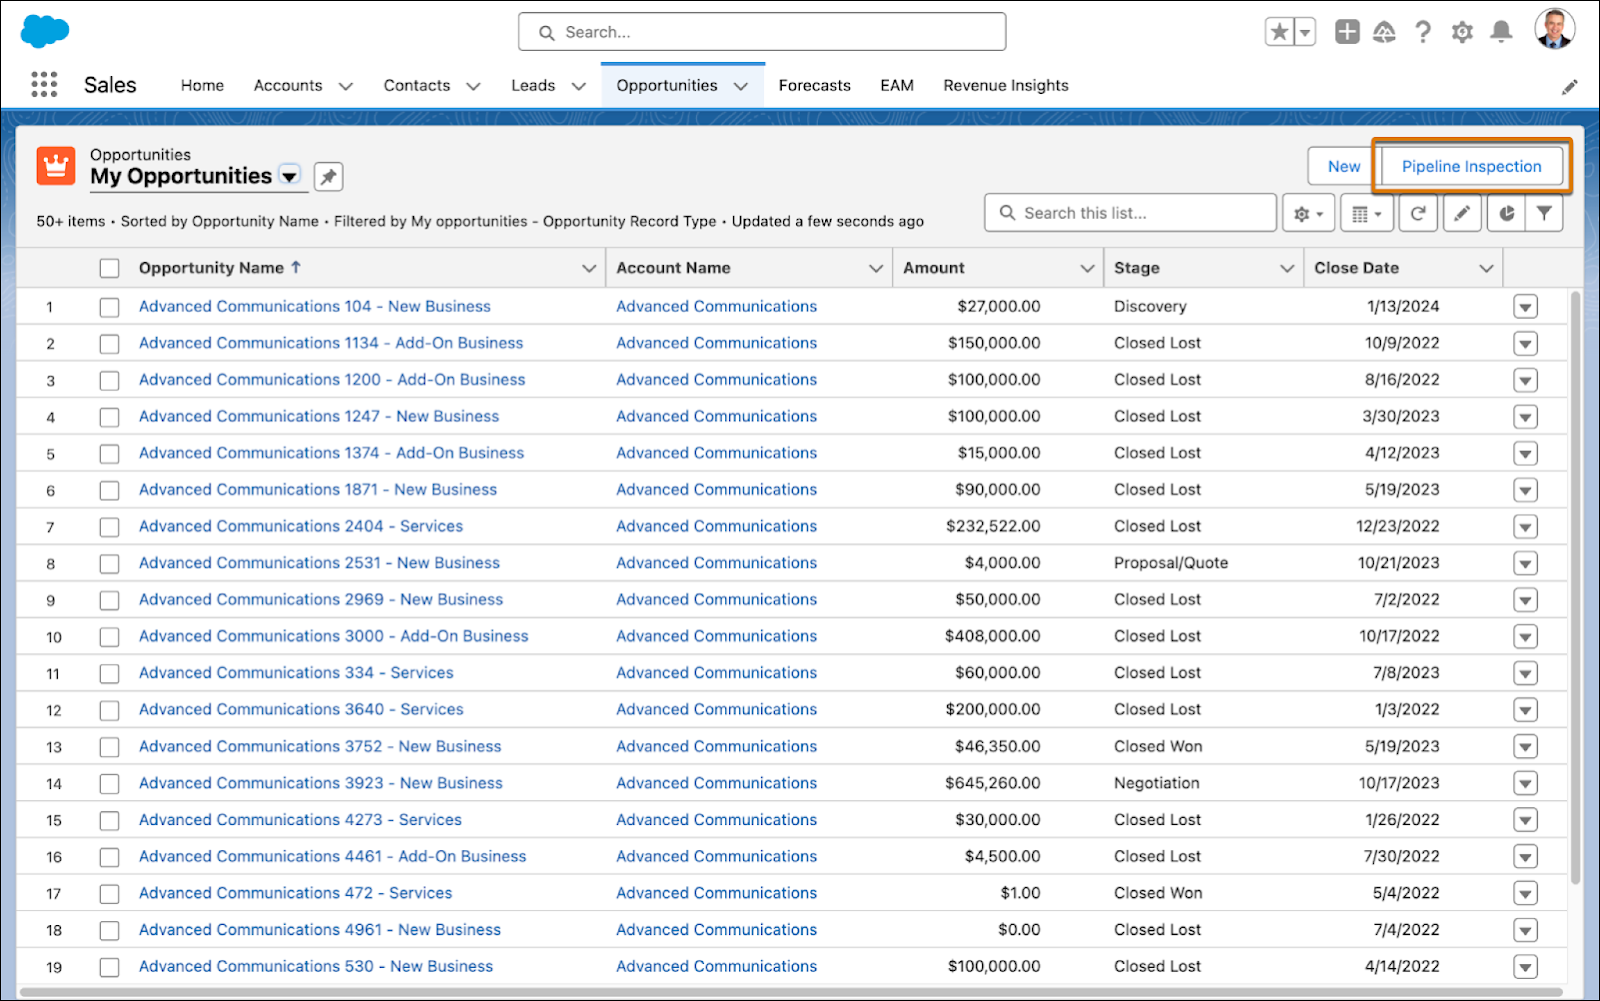
- Select Pipeline Inspection and see the new view.
For more information, see Set Up Pipeline Inspection in Salesforce Help.
Learn About Einstein Features and Set Up Flow Chart
Supercharge Pipeline Inspection with the power of analytics and Einstein. From Pipeline Inspection Setup, the Get the Most Out of Pipeline Inspection section shows you some of these intelligent features.
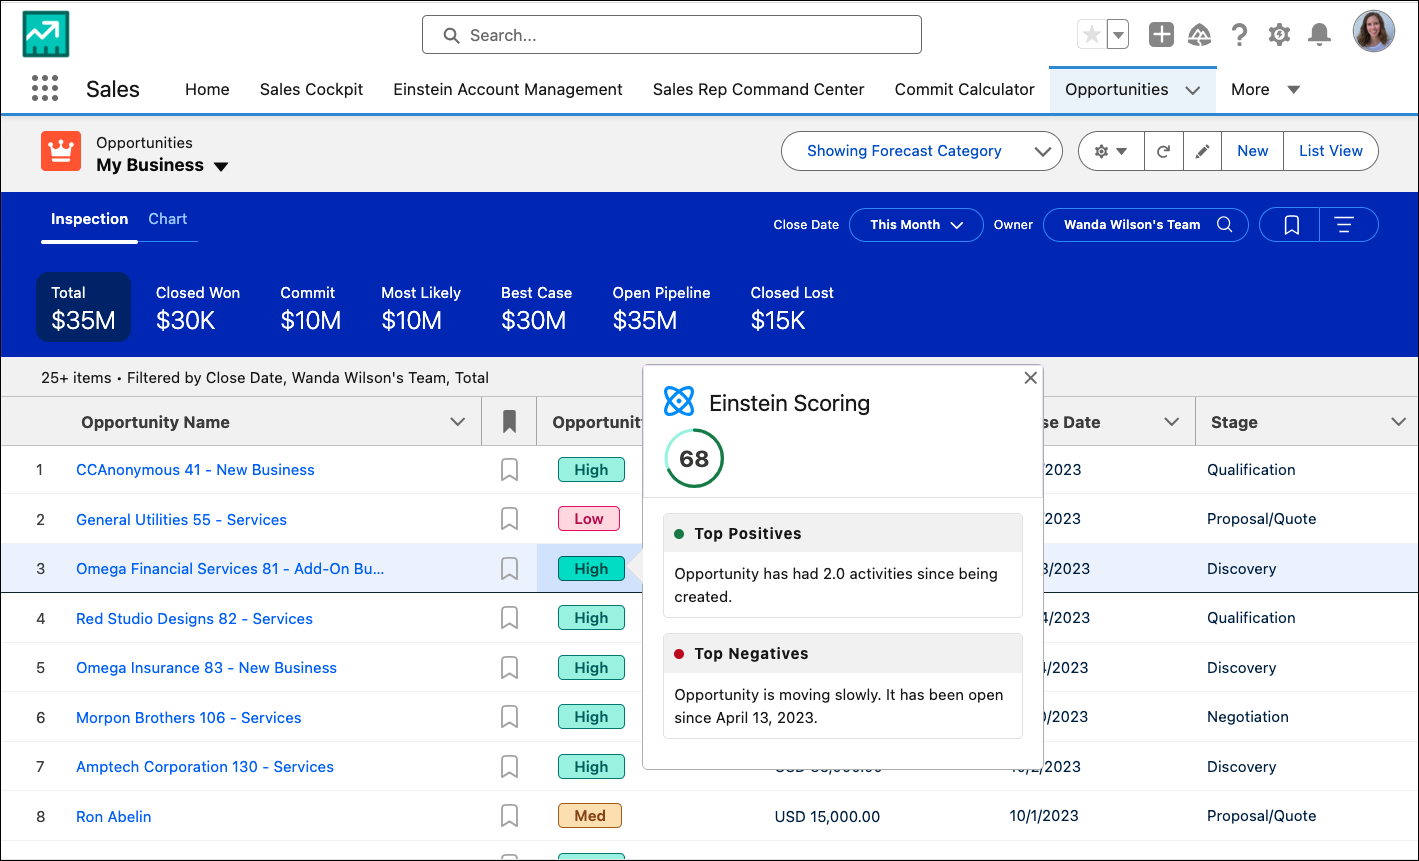
Einstein Opportunity Scoring
This feature helps sales teams learn from past opportunities. It uses AI to apply a score out of 100 to each opportunity, with a description of the reason for each score. While Get Cloudy isn’t ready to set up this feature yet, it can help make Pipeline Inspection even more useful.
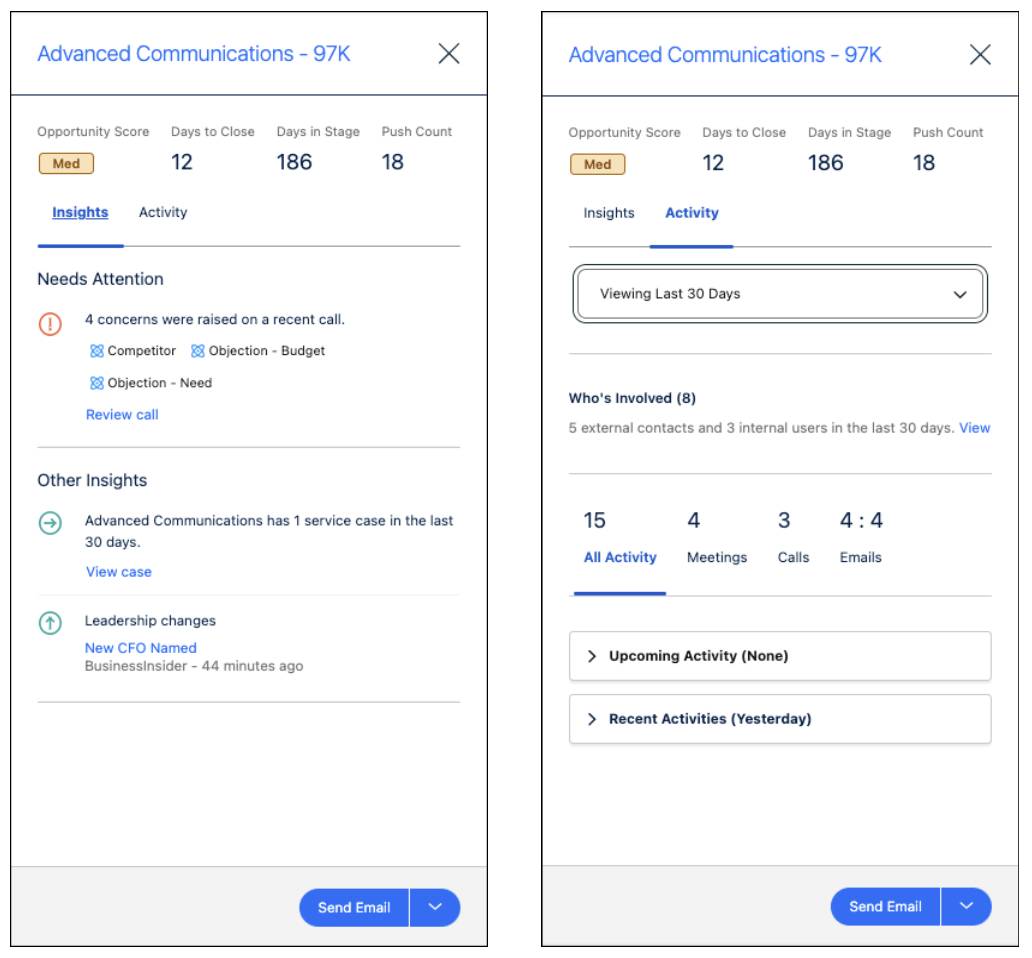
Einstein Deal Insights
This feature lets you pick insights that can help your sales team excel. It includes things such as insights about opportunity scores, patterns in activities, risks of a delayed close date, and service cases that could impact an opportunity. It surfaces these insights for the opportunity in a side panel. Some of these features require you to set up other things first, such as Einstein Activity Capture or Einstein Opportunity Scoring. Laura loves the idea of using Einstein to improve her team’s performance and plans to come back and set up these features later.
Pipeline Inspection Flow Chart
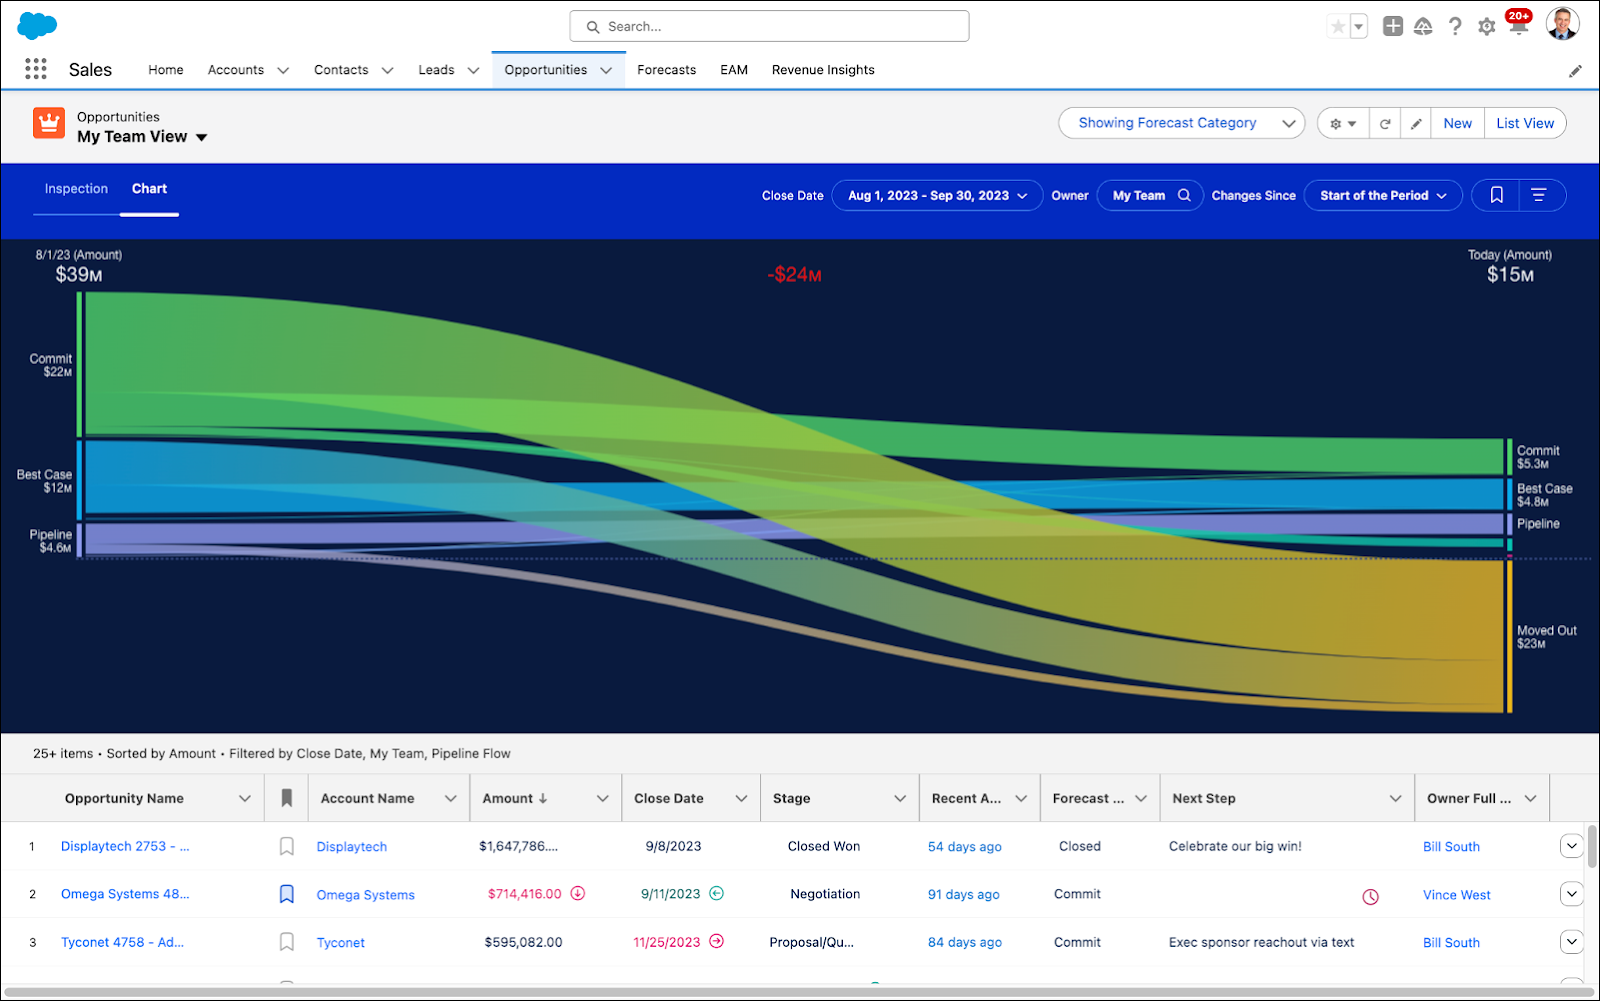
This feature allows Laura to visualize changes to her pipeline with two real-time charts. These charts show up in the Chart tab along the top of her Pipeline Inspection page.
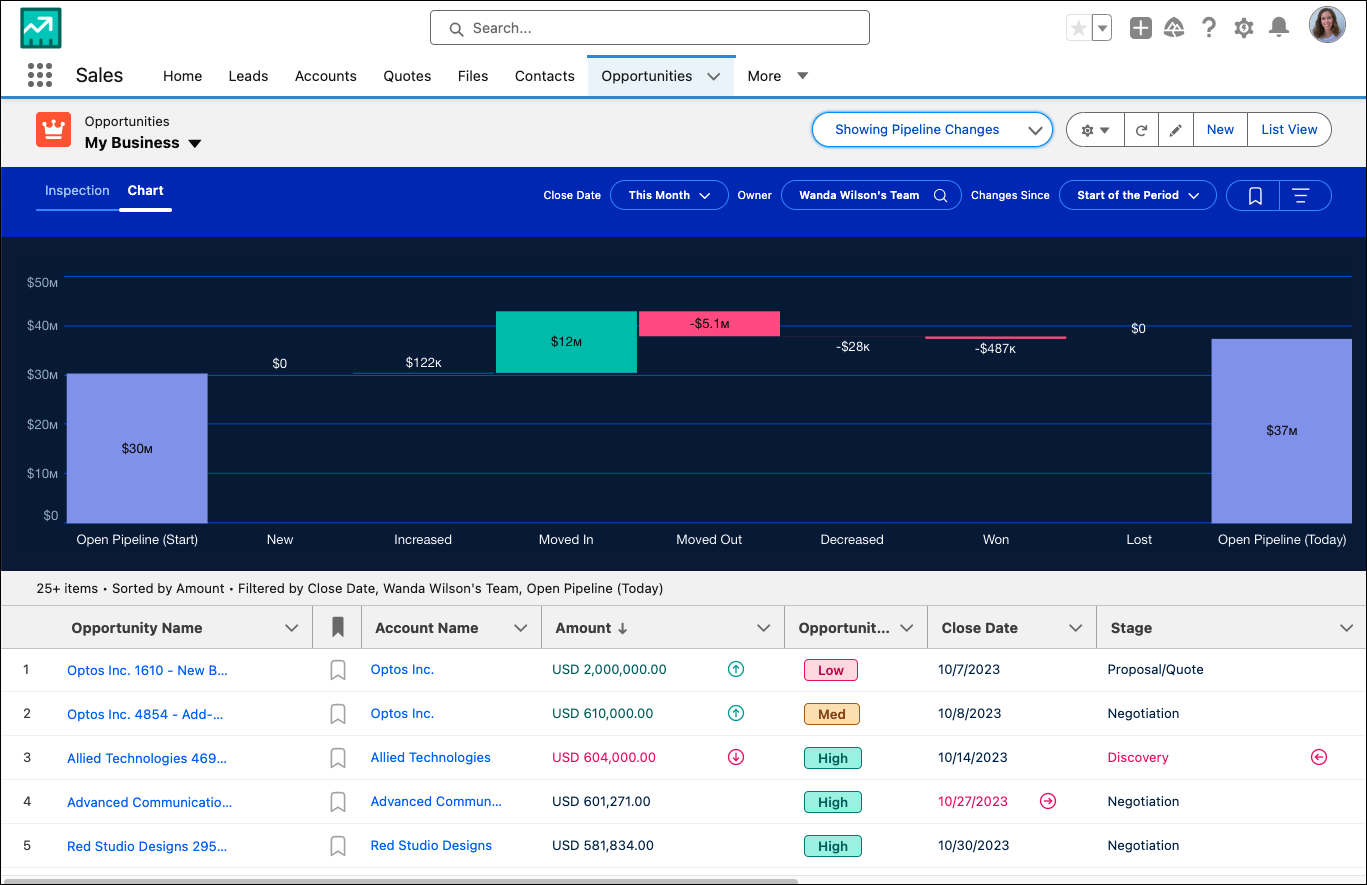
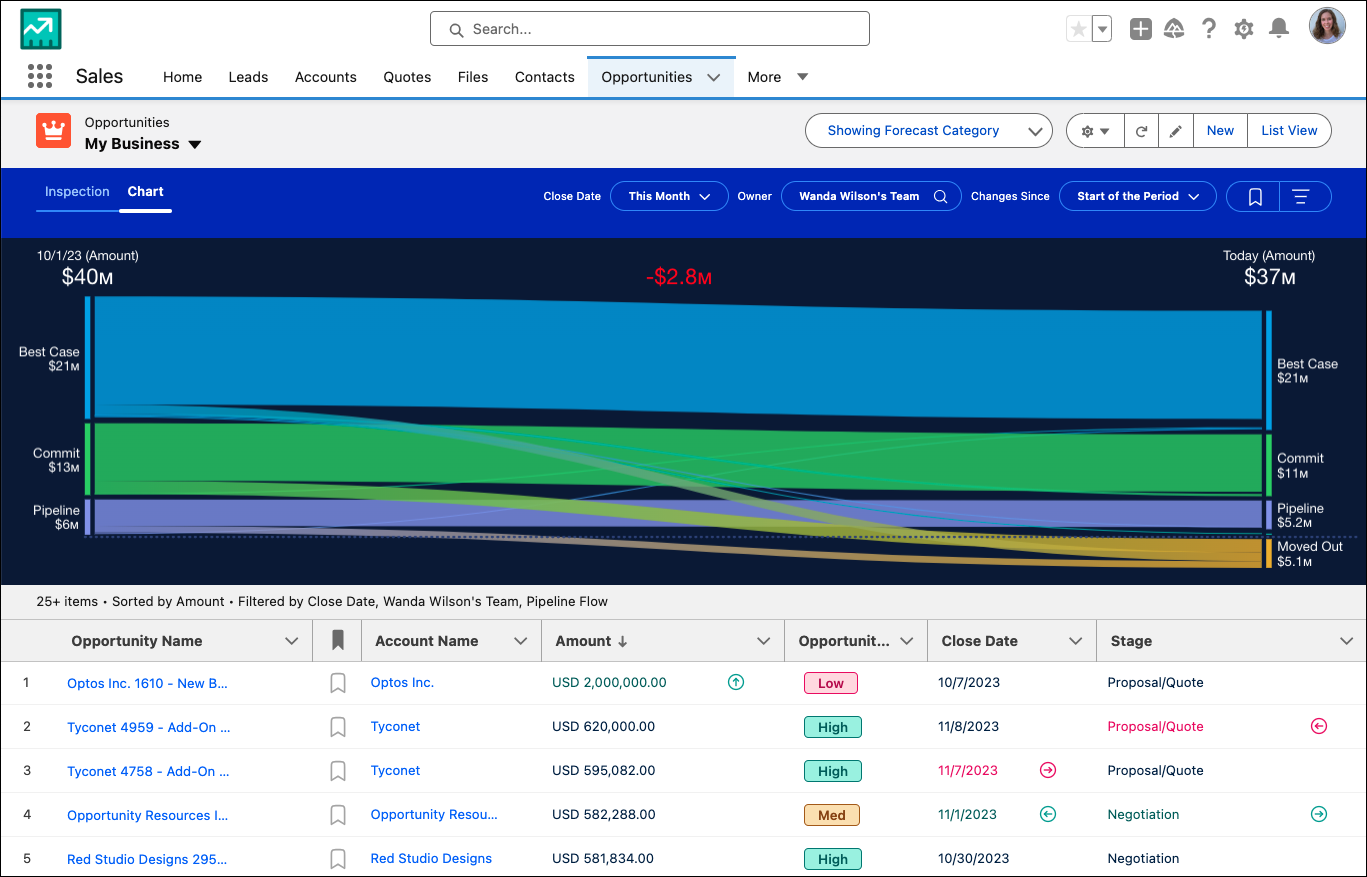
She can toggle between them using the Metrics dropdown. Pipeline changes are shown in a waterfall chart. Laura likes that there’s a flow chart showing changes in the forecast category.
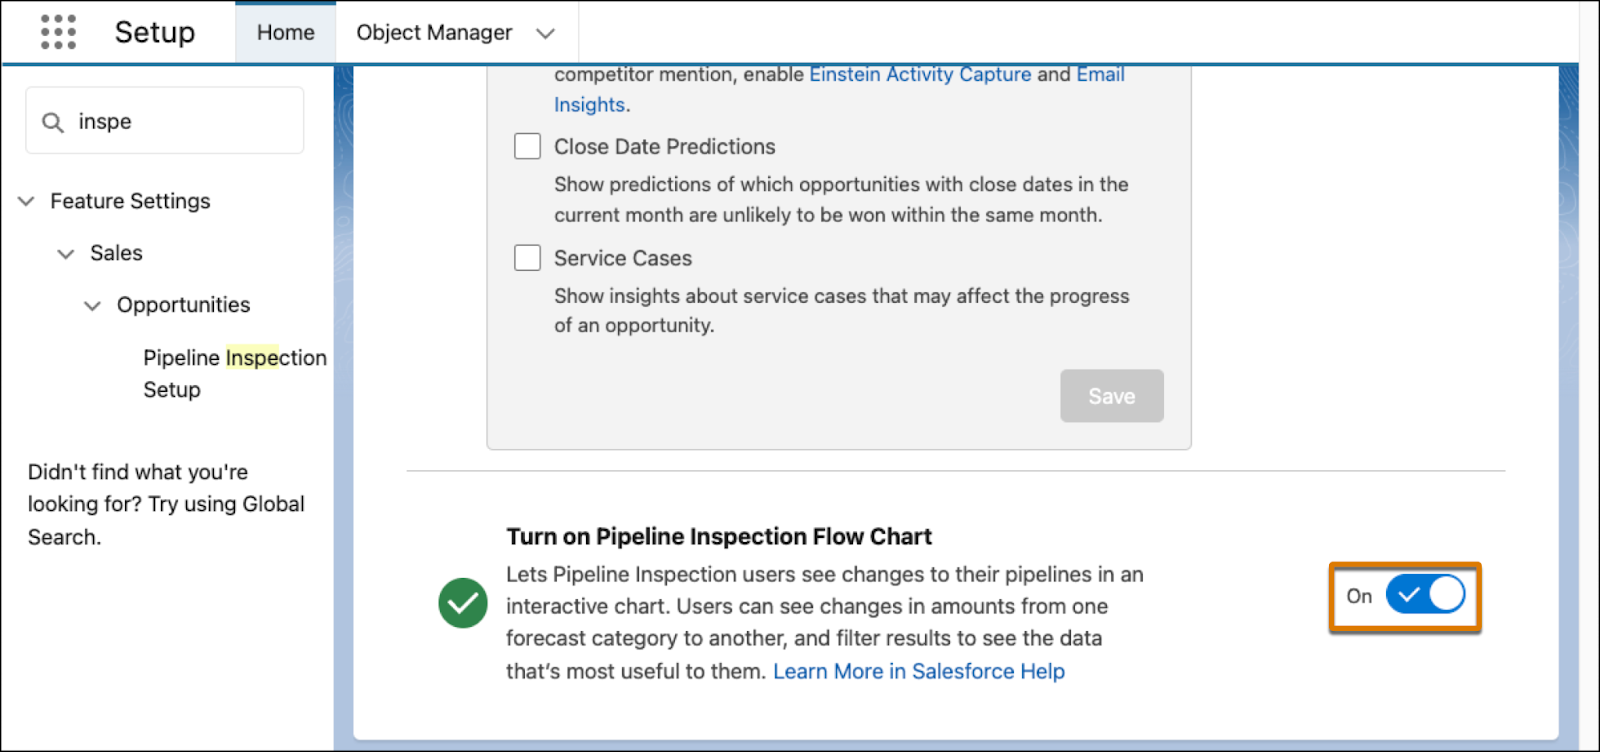
Laura wants to use this feature now. Luckily, it only takes one step to turn on. From Setup | Pipeline Inspection Setup, toggle the switch for Turn on Pipeline Inspection Flow Chart.
With the power of Einstein and intelligent features, Laura can help her team do their best work. Next, you make sure that they see the right numbers.
Set Up Metrics
In Pipeline Inspection, you can choose which field measures opportunities, and how this number is rolled up.
This summary field could be the standard Amount, Quantity, or Expected Revenue fields, or a custom number or currency field. At Get Cloudy, the sales team uses the standard Amount field.
To decide how this number is rolled up, you can choose either cumulative or single-category rollups. This setting determines what opportunities are included in the forecast categories in Pipeline Inspection.
-
Cumulative rollups include opportunities from a forecast category and all the subsequent categories. For example, a Best Case forecast with cumulative rollup shows the sum of opportunities in Best Case, Commit, or Closed Won.
-
Single category rollups only include opportunities from a forecast category. So your Best Case number shows the sum of opportunities in the Best Case category and doesn’t include Commit or Closed Won opportunities.
At Get Cloudy, Laura likes to see cumulative rollups. She normally adds up all her forecast categories manually, so she’s glad to save herself that trouble with cumulative rollups.
Go through the steps to make sure that you’re using the standard Amount field and cumulative rollups as she prefers.
- From Pipeline Inspection Setup, in the Manage Pipeline Metrics | Define How Metrics Are Summarized section, click Edit.
- By default, the standard Amount field is selected. Laura uses the Amount field so this works great for your situation. Select Cancel to close the metrics summary window, as you have not made changes.
- Next under Manage Pipeline Metrics | Define How Metrics Are Grouped, click Edit. Laura prefers cumulative rollups, which is the default option.
- Select Cancel to exit this setting as it’s set up.
Next, see Pipeline Inspection in action.
- Use the App Launcher to open the Sales app.
- Click the Opportunities tab.
- Click the Pipeline Inspection button.
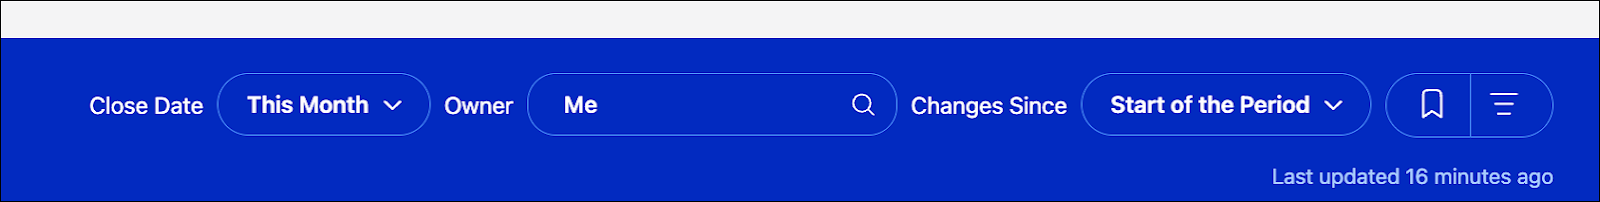
- In Pipeline Inspection, fill in the Closing Date and Owner to see opportunities that are relevant to you. In addition to these filters, the filter button on the far right allows Laura to add additional filters.
Now from Sales Cloud, Laura can go to the Opportunities tab and explore her pipeline by different teams, close dates, or even view changes over time.
As you show this new view to Laura, she sees several deals that seem unlikely to come in this quarter. She asks where she can enter an overall forecast number. Next, you set up Pipeline Forecasts so Laura and her team can forecast together.