Review Your Pipeline Forecasts Setup
Learning Objectives
After completing this unit, you’ll be able to:
- Explain how sales teams can work together to forecast.
- Identify the forecast types that you can use with Revenue Intelligence.
In this unit, you see how to configure Pipeline Forecasts for use with Revenue Intelligence. To learn more about Pipeline Forecasts, take the Sales Forecasting module.
In Pipeline Forecasts, a forecast is an expression of expected sales based on the gross rollup of a set of opportunities. An adjustment allows sales teams to change their rollup number without modifying the underlying opportunities.
For example, if Laura has $3M of opportunities (her forecast) but is optimistic that she can achieve more, she can adjust to $3.5M for the quarter (her adjustment).

Using the Pipeline Forecasts feature, sales reps and managers can view forecast rollups and adjust them to arrive at the most realistic forecast of their performance.
Each column in the forecast grid represents a forecast category: Pipeline, Best Case, Commit, and Closed. These categories are based on the stage an opportunity is in.
When you implement forecasts, you must take these steps.
- Enable Forecasts.
- Create Forecast types.
- Set up quotas.
- Enable Adjustments.
- Manage forecast rollups.
- Set up Forecast Role hierarchy.
- Add Date Range.
Understand the Forecast Type
What does a forecast mean to you? It turns out, each company forecasts slightly differently. To personalize your forecast, you create a Forecast Type.
Each Forecast Type is defined based on four main decisions.
Object |
What object (that is, Opportunity, Opportunity Split, and so on) do you forecast on? |
|---|---|
Measure |
What field do you use to track your revenue? |
Date |
What date field indicates when this revenue is expected? |
Hierarchy |
How do you roll up a forecast through your team? |
Revenue Intelligence dashboards are available for several of the most common forecast types. See Revenue Intelligence Dashboards for a full list.
In this case, Laura wants to base her forecasts on the Opportunity object and measure it based on the Amount field.
- From Setup | Sales | Forecasts | Forecast Settings, select Enable Forecasts.
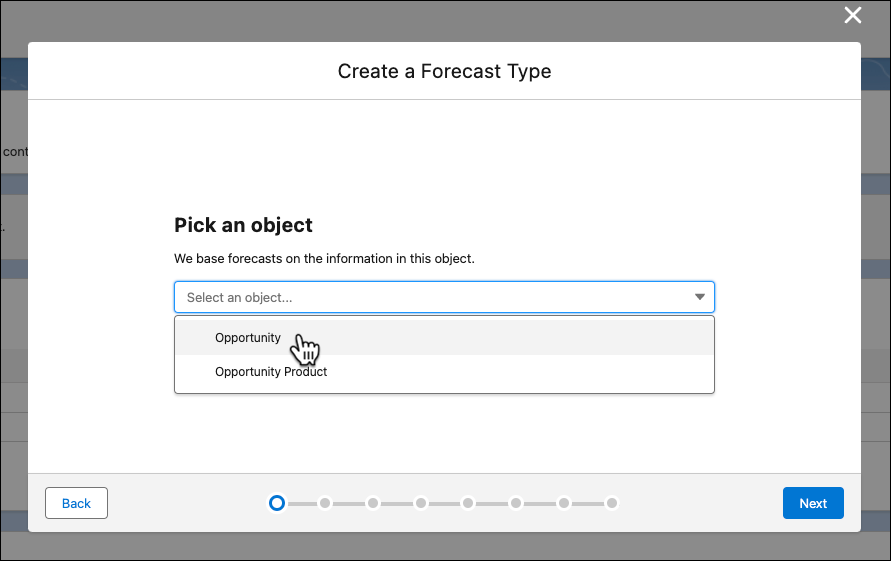
- Select Create a Forecast Type. If your sales team isn’t using an existing forecast type, it’s best to create one.
- In the guided flow, select the Opportunity object.
- For the measure, choose Amount.

- In the date type field, select the standard Close Date.

- Now select the User role hierarchy.

- The next window prompts you to add filters. Click Next.
- Filters are useful if you want to forecast on a subsegment of the business, for example, your renewals. For Laura’s use case, don’t add filters because you want to include all opportunities in the forecast.

- Filters are useful if you want to forecast on a subsegment of the business, for example, your renewals. For Laura’s use case, don’t add filters because you want to include all opportunities in the forecast.
- Name the forecast type
Get Cloudy Sales Forecast.
- Review your choices.

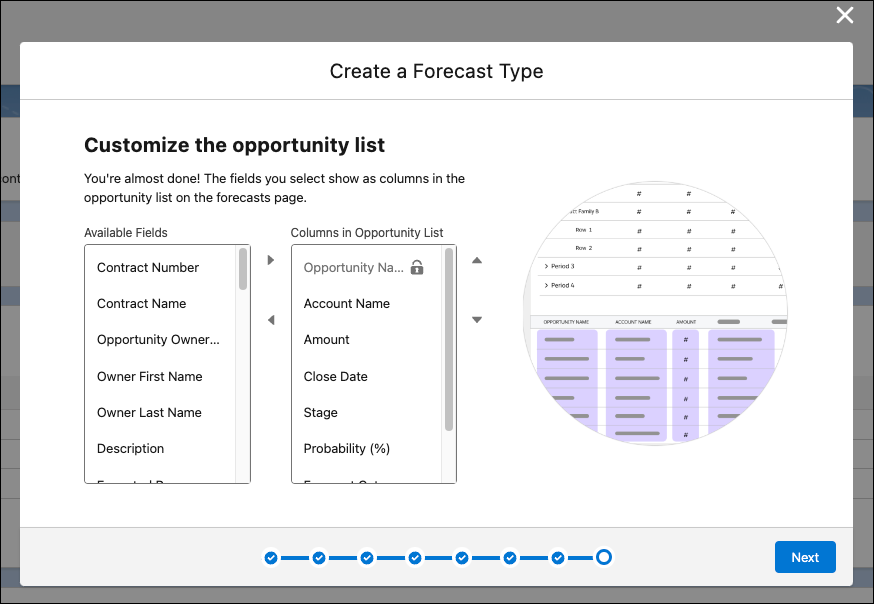
- As a final step, choose the fields to show up in the detail table in the Forecast tab.
- Select the dropdown arrow on the new forecast type and click Activate. You can have up to four active forecast types.

Enable Adjustments
An adjustment is when you modify a forecast rollup directly. For example, if you have $2.23M as the sum of your commit opportunities for Q4, you can choose to overwrite this number with $2.5M if you think you will hit a higher number. This adjustment remains until you update it. Both forecast managers and sales reps can make adjustments. Forecast managers can also adjust their forecasts and those of their subordinates.
Laura appreciates this feature because she knows that certain reps tend to be too optimistic or too conservative when assigning values to opportunities. Now she can account for this behavior in her adjustments. This feature also enables her reps to estimate the impact of things like new deals created in the period.
To allow managers to collaborate with sales teams, enable adjustments.
- From the Forecast Settings page, find Enable Adjustments and Judgments and click Edit.
- Select all three checkboxes to allow people to adjust their forecasts and those of their direct reports. Also, choose whether to display adjustments when hovering over a forecast cell or in columns for each adjustable forecast category.
- Click Save.

Manage Forecast Rollups
You can roll up forecasts in a category or cumulatively in Pipeline Forecasts. Hold on though, doesn’t that sound familiar? This setting is similar to the one you configured earlier in Pipeline Inspection. Depending on the requirements of your sales team, you can choose to configure these the same way or not.
In your case, Laura wants her cumulative rollups in both places. These rollups will show up in her Forecasts tab under the columns named after her forecast categories.

Here’s how to set a cumulative forecast.
- From the Forecast Settings page, scroll down to Manage Forecast Rollups and click Edit.
- Then select Cumulative category rollups.
- Click Save.

If you have existing adjustments, making this change deletes them. Since Get Cloudy hasn’t yet used their forecast type, you don’t have to worry about this and can accept the warning message.

Choose a Default Date Range
The date range specifies what period you want to track in forecasting. Align this period with how you track your forecasts, such as creating a forecast for each month or quarter.
At Get Cloudy, forecasts are tracked on a quarterly basis. Forecasts can be updated as often as you like, no matter what you choose here. Laura is going to have her team update their quarterly forecast every week before their forecast call.
Here’s how to configure this.
- Navigate to the Forecast Settings page.
- Under Choose a default date range, click Edit.
- Select Quarterly for the Forecast Period.
- In the Starting On field, select Current quarter.
In the Extending For field, select 4 quarters. This configuration means that the forecast grid displays the next four-quarters starting with the current one.

You may see a notification that your data will be deleted. Since Get Cloudy doesn’t have any data in this forecast type, you can accept and proceed.

Laura wants her team to track attainment against their quotas in the forecast tab. This tab shows a new Quota column in the grid and adds progress bars to each forecast category.

To turn this feature on:
- From the Forecast Settings page, go to Show Quotas.
- Click Edit.
- Check the Show quotas box.
- Click Save.

Set Up a Forecast Hierarchy
A forecast hierarchy is a nested, expandable list of forecast users that determine how forecasts roll up within a company and who can view and adjust them. The role-based forecast hierarchy is based on the user role hierarchy and allows you to specify which users are forecast managers.
When you talk to Laura about the Forecast Role Hierarchy, she scratches her head. “Don’t we already have a role hierarchy? Why do we need to do this again?” she asks. You explain to her that the forecast hierarchy is based on the role hierarchy, but allows you to specify who manages the forecast at each level. Forecast managers get the special ability to adjust forecasts for people beneath them in the hierarchy, and to share their forecast with others who must see it. The role-based forecast hierarchy is used in Revenue Intelligence to help people understand performance and trends relevant to the teams they manage.
Enable Users and Assign Forecast Managers
Laura asks you to make sure the forecast hierarchy is set up correctly.
- Go to Setup | Forecasts | Forecasts Hierarchy

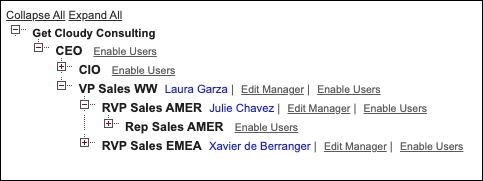
Here you can see Laura’s role as VP of Worldwide Sales, reporting to the CEO. She also has regional vice presidents who report to her, and manage the sales reps.
- Go through and enable users at each level, starting with Laura.
- Click the Enable Users link next to VP Sales WW, and move her into the Enabled Users pane on the page for this role.
-
Note: Even if she was enabled in the role hierarchy, you must enable her here too.
-
Note: Even if she was enabled in the role hierarchy, you must enable her here too.
- After saving, assign the rest of the sales team to the appropriate level in the forecast hierarchy

Only enable users who participate in forecasting. No need to enable your CIO, she has enough to deal with and won’t be estimating sales performance.
After you’ve enabled a manager, their name appears in blue next to their role. Here you can see Laura and her regional VPs Julie and Xavier. At the lowest level of the hierarchy, her reps aren’t shown because they don’t manage a forecast other than theirs.
Set Up Quotas
When you set up quotas, Pipeline Forecasts can display a quota column for each user in your hierarchy or help you track their attainment against quota. It can also be used in calculated columns to determine the gap to quota or pipe coverage.
After you set up Revenue Insights, the quota data is the basis for KPIs shown on the Overview tab.

To enable quotas:
- From Setup, go to Sales | Forecasts | Forecast Quotas.
- Select the forecast period and the forecast type you created.

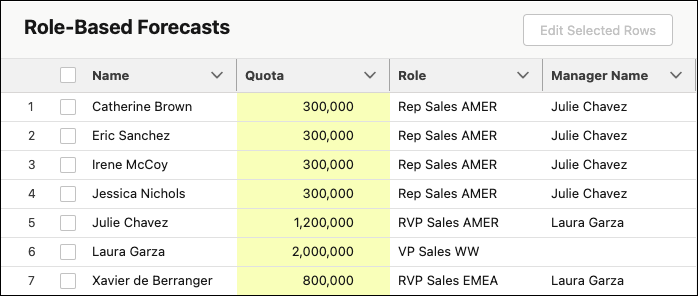
- Click Show Quotas to display a table with each user and their role.
- In the quota cells, click the edit icon (
 ) for each user and enter the quotas Laura provided for the leaders and sales reps.
- Click Save.
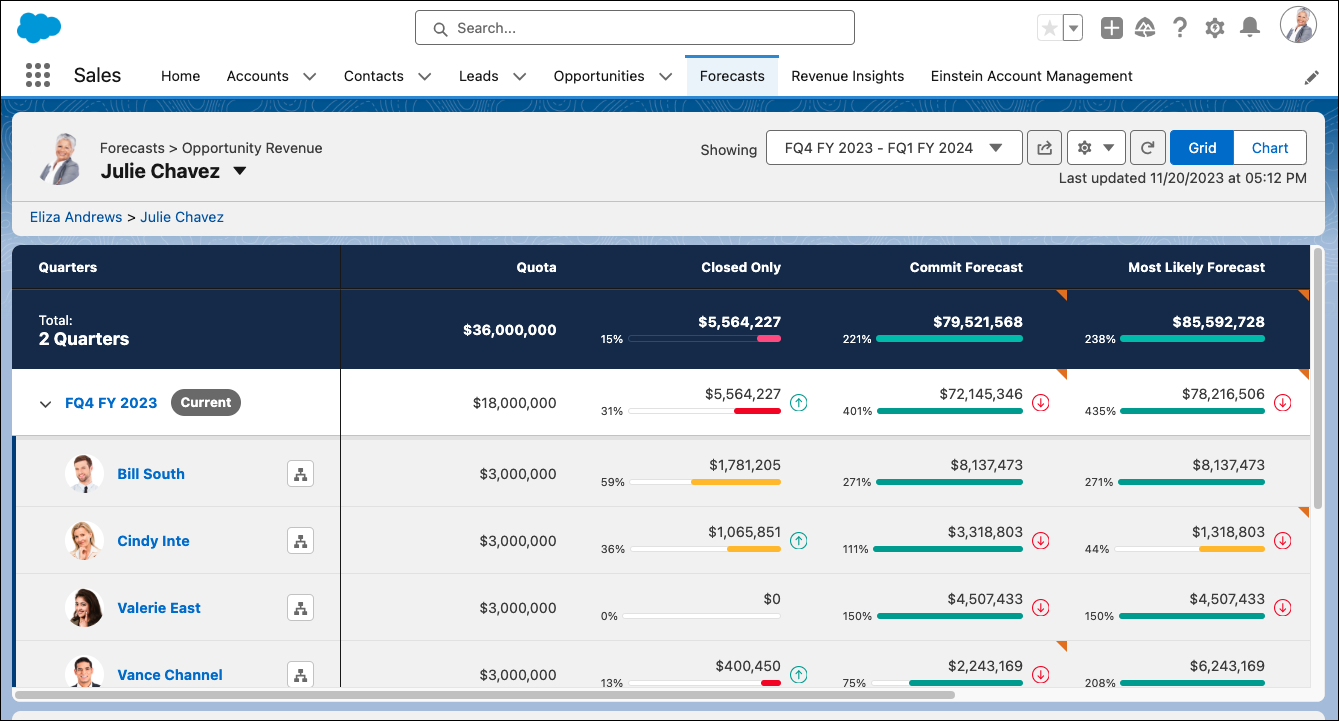
- Go to Apps | Sales and select the Forecasts tab to see if your forecasts are set up correctly. You can edit the forecast by clicking the edit pencil on one of the cells in the grid.

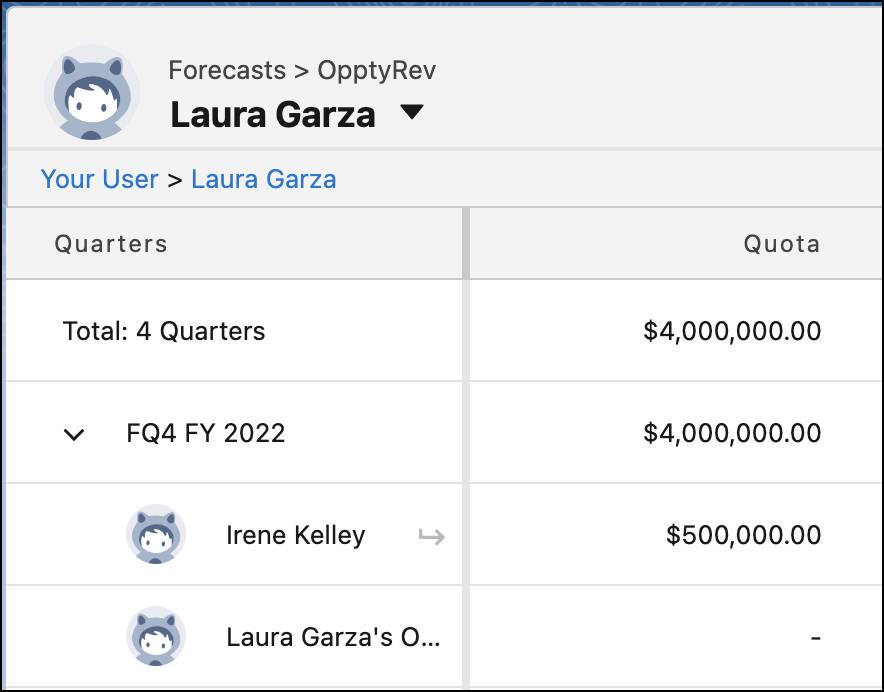
To explore what this page looks like for Laura Garza, click your username and type in Laura Garza. You can view her forecast because she is in a child role in the forecast hierarchy compared to you.

If you expand Q4 in Laura’s view, you can see quota data for Laura’s reports for the quarter.
This is great progress! Laura is glad to move on from using spreadsheets.