Explore Forecast Facts and Create Forecast Sets
Learning Objectives
After completing this unit, you'll be able to:
- Describe the Forecast Fact objects for program-based business.
- Explain the relationship between forecast facts and forecast sets.
- Create period groups and dimensions for a forecast set.
- Create and configure forecast sets for programs, variants, and components.
Explore Forecast Facts
Manufacturing comes with three Forecast Fact objects.
- Manufacturing Program Forecast Fact
- Manufacturing Program Variant Forecast Fact
- Manufacturing Program Component Forecast Fact
Susan explores how to use the fields in these objects to model the measures and dimensions for each level of forecast: program, variant, and component.
Manufacturing Program Forecast Fact: When Jackie imports the production forecasts based on research data from IHS Markit using CSV files, this is the target object where the data gets transformed into program forecasts. Let’s look at an example.

Here’s a table that lists sample values for two Manufacturing Program Forecast Fact records.
|
Period
|
Production Model
|
Production Location
|
Program Quantity
|
Market Share Percent
|
Expected Revenue Per Unit
|
|---|---|---|---|---|---|
January 2022 |
PowerUp Car |
New York |
30,000 |
25 |
2,500 |
February 2022 |
PowerUp Car |
Detroit |
40,000 |
40 |
4,000 |
Each row translates to a record in the Manufacturing Program Forecast Fact object. But how can Susan use this data? Susan can use the Production Location field as a forecast dimension when she later creates a forecast set for manufacturing programs. This helps Jackie view the forecasted quantity and revenue of PowerUp Car for each manufacturing plant location.
Susan can also define the Market Share Percent and Expected Revenue Per Unit as measures when she defines the forecast set, since those fields are available out of the box. So for the Jan 2022 month, Jackie can see that 25% of the total quantity (30,000) of PowerUp Cars will be produced out of New York. And for each car that’s manufactured at this plant, the expected revenue per unit for Xela is $2,500.
Manufacturing Program Variant Forecast Fact: When Jackie imports the production forecasts based on research data from IHS Markit using CSV files, this is the target object where the data gets transformed into program variant forecasts. Let’s look at an example.
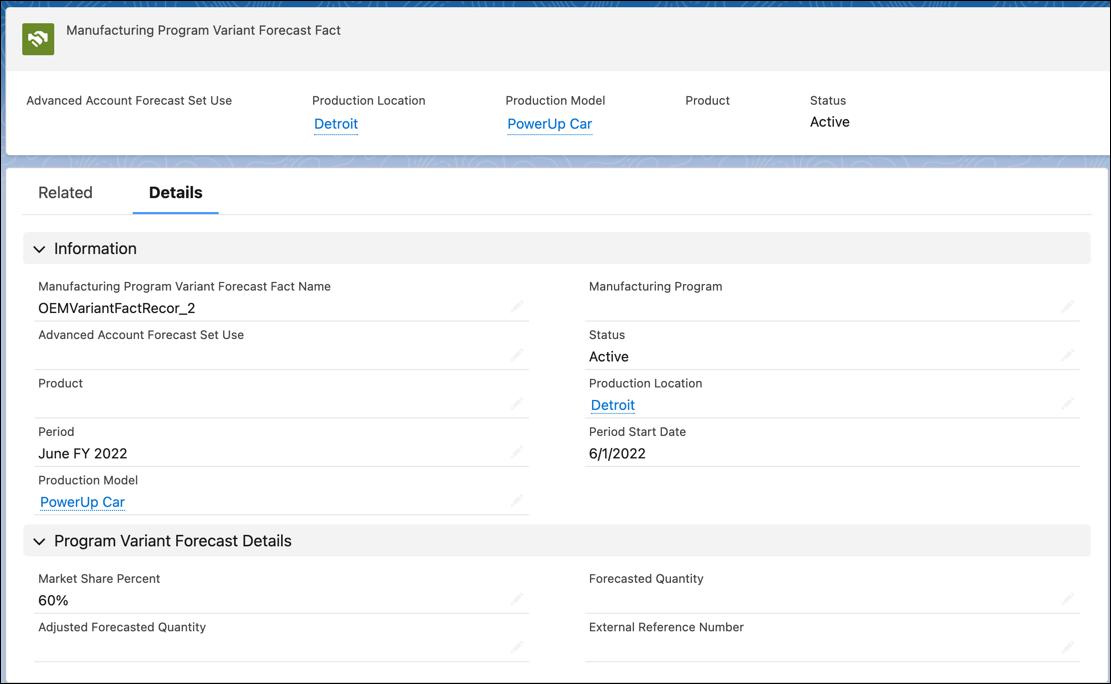
Here’s a table that lists sample values for two Manufacturing Program Variant Forecast Fact records.
|
Period
|
Production Model
|
Product
|
Production Location
|
Market Share Percent
|
|---|---|---|---|---|
January 2022 |
PowerUp Car |
PowerUp XZ |
New York |
40 |
January 2022 |
PowerUp Car |
PowerUp XZ Plus |
Detroit |
60 |
Each row translates to a record in the Manufacturing Program Variant Forecast Fact object. Susan can use the Production Location and Product fields as forecast dimensions when she later creates a forecast set for manufacturing program variants. This helps Jackie view the forecasted quantity and revenue of PowerUp Car by location and by variant.
Susan can also define the Market Share Percent as a forecast set measure when tracking forecasts at a variant level. So for the month Jan 2022, Jackie can see that 40% of the PowerUp Cars will be of the XZ variant.
Manufacturing Program Component Forecast Fact: When Susan triggers the Data Processing Engine (DPE) jobs to calculate component-level forecasts, this is the target object where the data is written back by the DPEs. Let’s look at an example.

Here's a table that lists sample values for two Manufacturing Program Component Forecast Fact records.
|
Period
|
Product
|
Component
|
Production Location
|
Total Cost Per Unit
|
Expected Profit Per Unit
|
Selling Price Per Unit
|
|---|---|---|---|---|---|---|
January 2022 |
PowerUp XZ |
Wheels |
New York |
60 |
50 |
110 |
PowerUp XZ Plus |
Brakes |
New York |
55 |
65 |
120 |
Each row translates to a record in the Manufacturing Program Component Forecast Fact object. And the object has out-of-the-box fields that Susan can use as forecast dimensions and measures. She can use fields Production Location, Product, and Component as forecast dimensions, and fields Total Cost Per Unit, Expected Profit Per Unit, and Selling Price Per Unit as forecast set measures.
Forecast Facts and Forecast Sets
Let’s understand how forecast facts are related to forecast sets.
Each forecast set is associated with a forecast fact object. You can use the fields from a forecast fact object either as dimensions or as measures in a forecast set.
When you select a field as a dimension, the resulting forecast is aggregated by this field. In other words, if the Production Location field on the Manufacturing Program Forecast Fact object is used as a dimension in a forecast set, the Xela PowerUp program forecasts show cumulative quantities and revenues for each production location.
When you select a field as a measure, you choose the metrics that you want to display on the forecast view. In other words, if the Expected Profit Percent field on the Manufacturing Program Forecast Fact object is used as a measure in a forecast set, Expected Profit Percent shows up as a metric on the forecast display for the Xela PowerUp program.
Period Groups and Dimensions
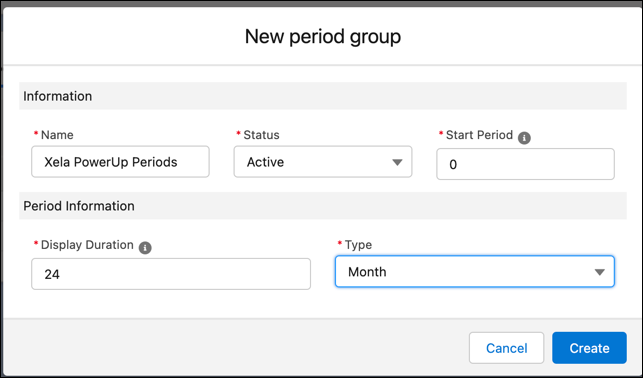
A period group defines the forecast frequency, the number of periods for which the forecast is displayed, and the first period from which forecasts are generated. Let’s follow along as Susan creates period groups and dimensions for forecast sets.
Jackie wants to view forecasts at a monthly level, starting from the current month. At any given point in time, she wants to view forecasts for 24 months in total. Susan creates and defines the period group accordingly. Susan will use this period group for all three forecast sets that she creates for programs, variants, and components.

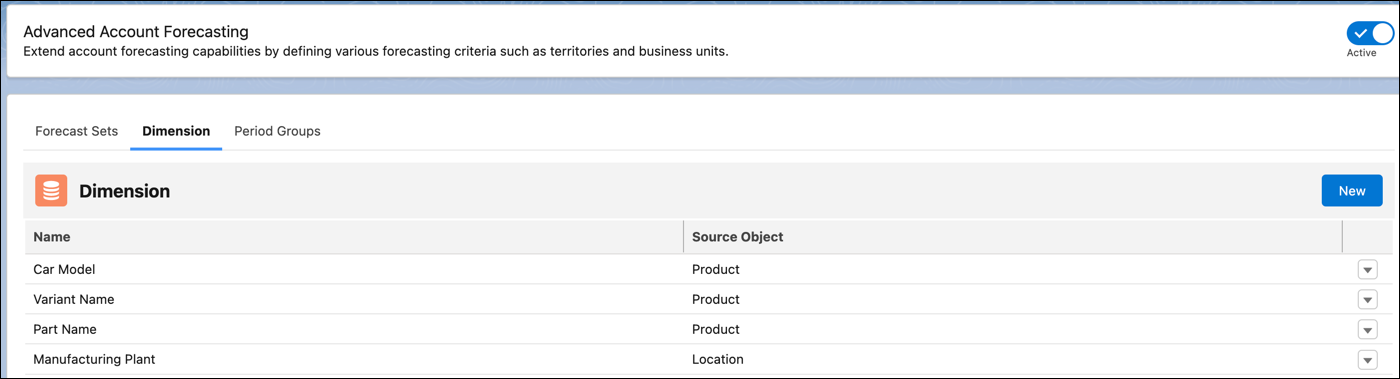
Next, Susan creates the dimensions by which forecasts will be aggregated. Jackie wants the following dimensions for each level.
Forecast Level |
Dimension Name |
Field in Forecast Fact |
Source Object |
|---|---|---|---|
Program |
Manufacturing Plant |
Production Location |
Location |
Car Model |
Production Model |
Product2 |
|
Variant |
Manufacturing Plant |
Production Location |
Location |
Car Model |
Production Model |
Product2 |
|
Variant Name |
Product |
Product2 |
|
Component |
Manufacturing Plant |
Production Location |
Location |
Variant Name |
Product |
Product2 |
|
Car Model |
Production Model |
Product2 |
|
Part Name |
Product Component |
Product2 |
Forecast Sets for Programs and Variants
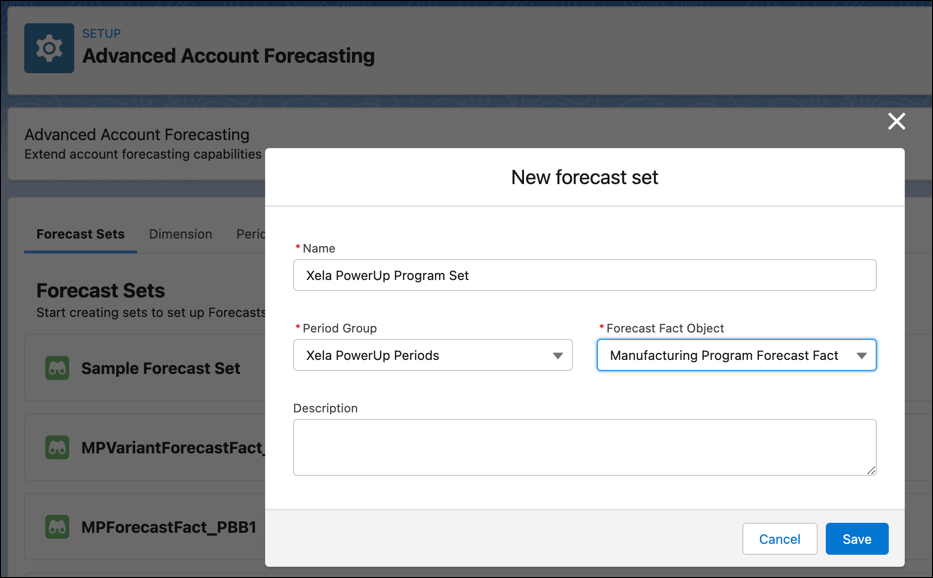
Susan must now create forecast sets for programs, variants, and components, and then configure each forecast set. Susan creates the following three forecast sets.
Name |
Period Group |
Forecast Fact Object |
|---|---|---|
Xela PowerUp Program Set |
Xela PowerUp Periods |
Manufacturing Program Forecast Fact |
Xela PowerUp Variants Set |
Manufacturing Program Variant Forecast Fact |
|
Xela PowerUp Components Set |
Manufacturing Program Component Forecast Fact |
Susan defines the configurations that determine the forecast display at a program level.
-
Forecast Frequencies: Jackie wants to calculate forecasts every month, with new forecast periods added to the display at the end of each month. Susan selects Monthly for both Calculation Frequency and Rollover Frequency.

-
Dimensions: Susan selects Manufacturing Plant and Car Model as the dimensions. She selects the display order as 1 and 2 respectively so that data is first aggregated by the manufacturing plant, and then by each car model.

-
Measures: Susan adds the following measures and defines how they should be calculated.
Name |
Forecast Fact Measure Field |
Measure Type |
Aggregation Type |
Calculation Method |
Track Adjustments |
|---|---|---|---|---|---|
Program Quantity |
Program Quantity |
Quantity |
Sum |
Batch Process |
No |
Expected Revenue |
Expected Revenue Per Unit |
Revenue |
Sum |
Batch Process |
No |

-
Adjustment Periods: Jackie wants account managers to edit forecasts for the first 5 days each month and engineering managers to edit the forecasts for the next 5 days. Susan accordingly defines two adjustment periods for the two user profiles.

For the Xela PowerUp Variants Set, Susan keeps most configurations similar to the Xela PowerUp Program Set. She just selects different dimensions and measures.
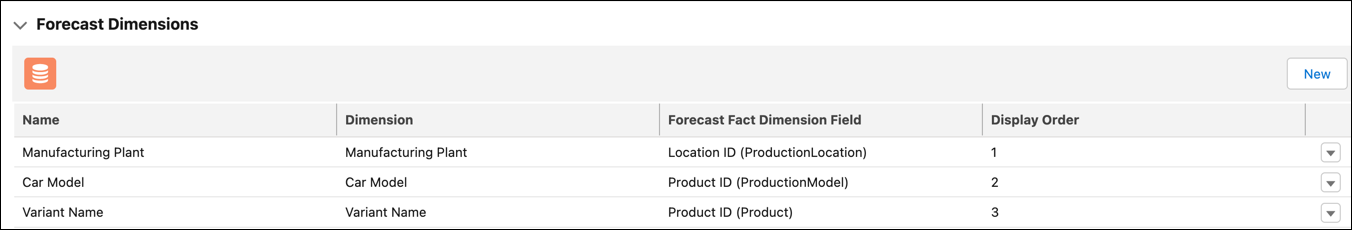
-
Dimensions: Susan selects Manufacturing Plant, Car Model, and Variant Name as the dimensions. She selects the display order as 1, 2, and 3 respectively so that data is first aggregated by the location, and then by the car and variants.
-
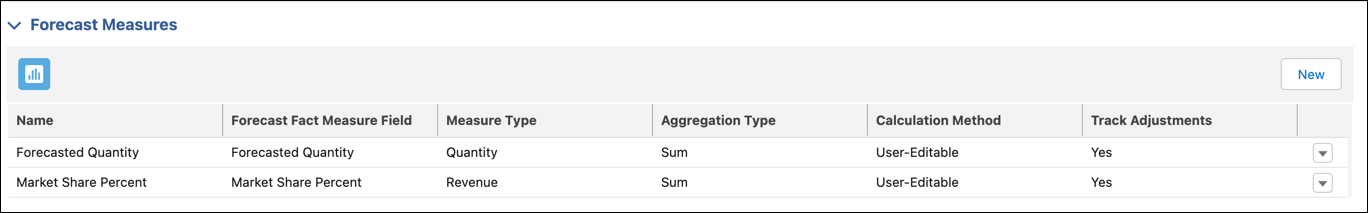
Measures: Susan adds the following measures and defines how they should be calculated.
Name |
Forecast Fact Measure Field |
Measure Type |
Aggregation Type |
Calculation Method |
Track Adjustments |
|---|---|---|---|---|---|
Market Share Percent |
Market Share Percent |
Quantity |
Sum |
User-Editable |
Yes |
Forecasted Quantity |
Forecasted Quantity |
Quantity |
Sum |
User-Editable |
Yes |
Forecast Set for Components
For the Xela PowerUp Components Set forecast set, Susan keeps most configurations similar to the previous two forecast sets, with a few modifications.
-
Data Processing Engine Definitions: Susan has already cloned and customized the four predefined DPE templates with Process Type as Program-Based Business. She selects the cloned definitions in the forecast set to calculate, recalculate, generate, and regenerate the forecasts.
-
Dimensions: Susan selects Manufacturing Plant, Car Model, Variant Name, and Part Name as the dimensions. She selects the display order as 1, 2, 3, and 4 respectively so that data is first aggregated by the location, then by the product and its variants, and then by each part required for each variant.

-
Measures: Susan adds the following measures and defines how they should be calculated.
Name |
Forecast Fact Measure Field |
Measure Type |
Aggregation Type |
Calculation Method |
Track Adjustments |
|---|---|---|---|---|---|
Forecasted Revenue |
Forecasted Revenue |
Revenue |
Sum |
User-Editable |
Yes |
Forecasted Quantity |
Forecasted Quantity |
Quantity |

More About DPE Definitions
For program and variant forecast sets, you don’t have to select DPE definitions for calculation, regeneration, rollover, and recalculation. That’s because the forecast data is uploaded by CSV files at regular intervals. You also don’t need to define measure groups or forecast formulas.
But you can use DPE definitions to apply calculation logic to the third-party program forecast data that’s in the CSV files. The transformed data is then written back to the Program or Variant fact object. For this, you must create DPEs from scratch.
For component forecasts, the predefined DPE definitions calculate the forecasts by deriving input values from program forecasts, variant forecasts, and other details such as the lead time for a component. The DPE writes the values for Forecasted Quantity and Forecasted Revenue back to the Manufacturing Program Component Forecast Fact object as separate records for each period. And you can customize the DPE to calculate the values for other measures such as Total Cost, Expected Revenue Per Unit, and Profit. Or you can import CSV files to populate these values.
Susan has completed some major tasks. In the next unit, she creates a program template that Jackie can use to create the Xela PowerUp program.
Resources
- Salesforce Help: Forecast Fact Objects with Program Based Business
- Salesforce Help: Create a Period Group for Program Based Business
- Salesforce Help: Create a Dimension for Program Based Business
- Salesforce Help: Program Based Business Terminology
- Salesforce Help: Create a Forecast Set for Program Based Business