Identify Performance Issues in the Bad Bunch App
Learning Objectives
After completing this unit, you’ll be able to:
- Demonstrate different ways to throttle the performance.
- Use the Performance monitor to locate DOM node issues.
Excessively Expensive Event Calls
In the previous unit, we troubleshooted a poorly performing Lightning web component with bad placement of code in a loop. Let’s take a look at another bad example and how to troubleshoot it.
- With the Bad Bunch app open, select Example 2: Scroll List and wait for the page to load completely.
- In the DevTools Performance panel, click
 to start a profile recording.
- Now scroll the list under Scroll This List!

It should seem a bit slow or jerky.
- In the Performance panel, click Stop to end the recording and let it compile the data.

Look in the Main section at all those JavaScript events getting called. And notice all the little red triangles.

The red triangle is Chrome’s way of saying this may have taken too long.
- Move down the call stack and click one of the onScroll events to get the details in the Summary tab.

Notice this is coming from our code, the onScroll method in the example2_ScrollList.js file. On line 87, to be exact.
- In the Summary panel, click the link to example2_ScrollList.js to go to the Sources panel with the code displayed.

Look at line 82:li.style.background = ‘#edede’;.
We are adding styling with code with every scroll. This is something that should be handled a different way. It adds a lot of overhead to the event. There are CSS (Cascading Style Sheets) pseudo-classes like tr:nth-child(even) and tr:nth-child(odd) for this exact purpose. A CSS approach will always be faster than using JavaScript.
Another issue here is the lack of a debouncer to keep the event from firing so often. Adding a listener to a scroll event will cause it to fire a ton. If that event is doing expensive operations, it is even worse. Check the Resources for more info on this.

Rendering Recalculated Styles
- With the Bad Bunch app open, select Example 3: Input Fields.
For this example, you may need to throttle the CPU.
- In Capture Settings (
 ), for CPU, select 4x slowdown to demonstrate a slower browser.
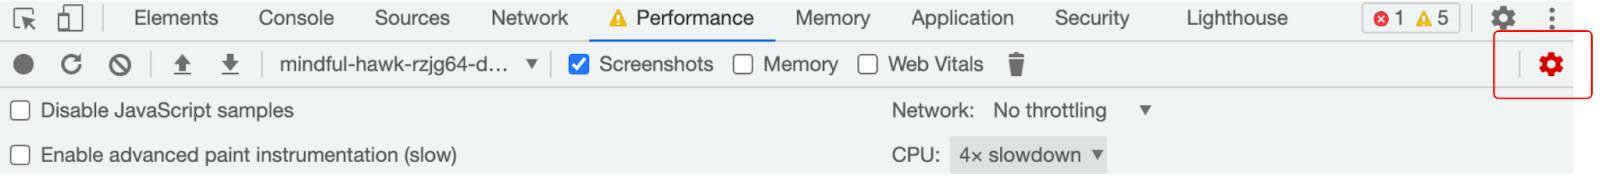
Notice the warning icon next to Performance and the red Capture Settings icon set as reminders that the screen is throttled. Throttling is relative to your computer’s capabilities. For example, the 4x slowdown option makes your CPU operate 4 times slower than its usual ability.
- In the DevTools Performance panel, click
 .
.
- Start typing in Input #1.

A jarring experience, not smooth at all.
- Start typing in Input #2. Much smoother.
- In the Performance panel, click Stop to end the recording and let it compile the data.
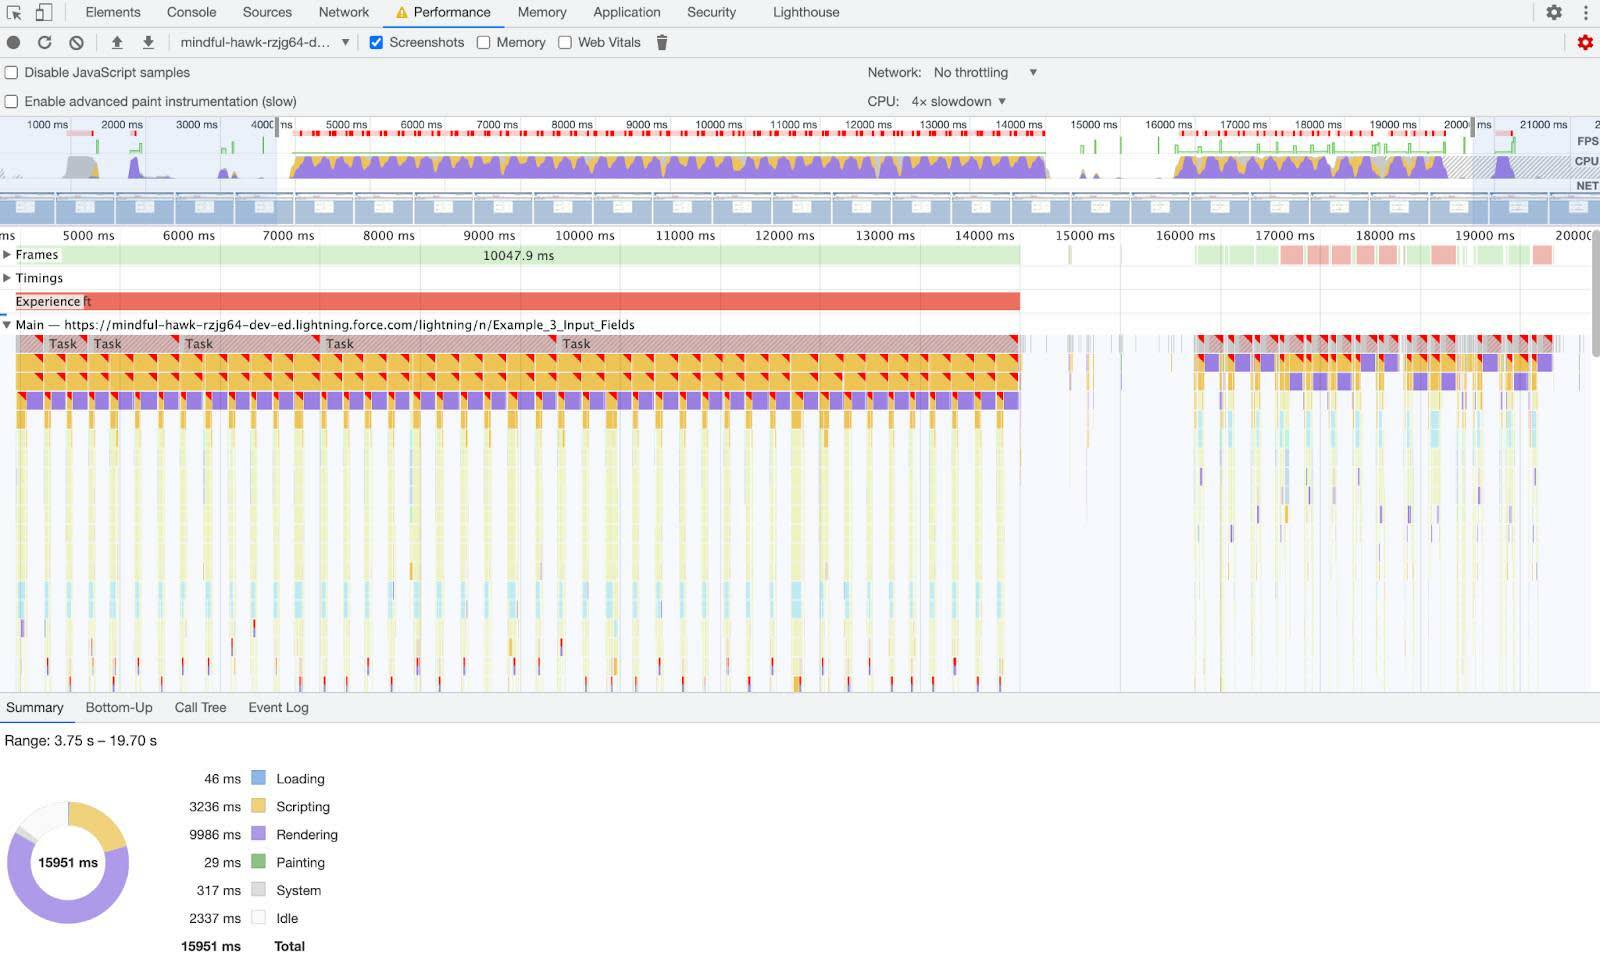
The CPU chart displays a lot of purple. Checking in the Summary tab shows that purple represents Rendering. A majority of the time is going to Rendering. There’s a lot of red triangles too.
Let’s zoom in on just a small section. But first, let’s turn off the CPU throttling.
- In Capture Settings (
 ), turn the CPU throttling off.
It’s a good practice to turn off any throttling as soon as you are done using it since it continues to throttle even when the recording has stopped.
- Click and drag your mouse through a small section of the CPU chart.
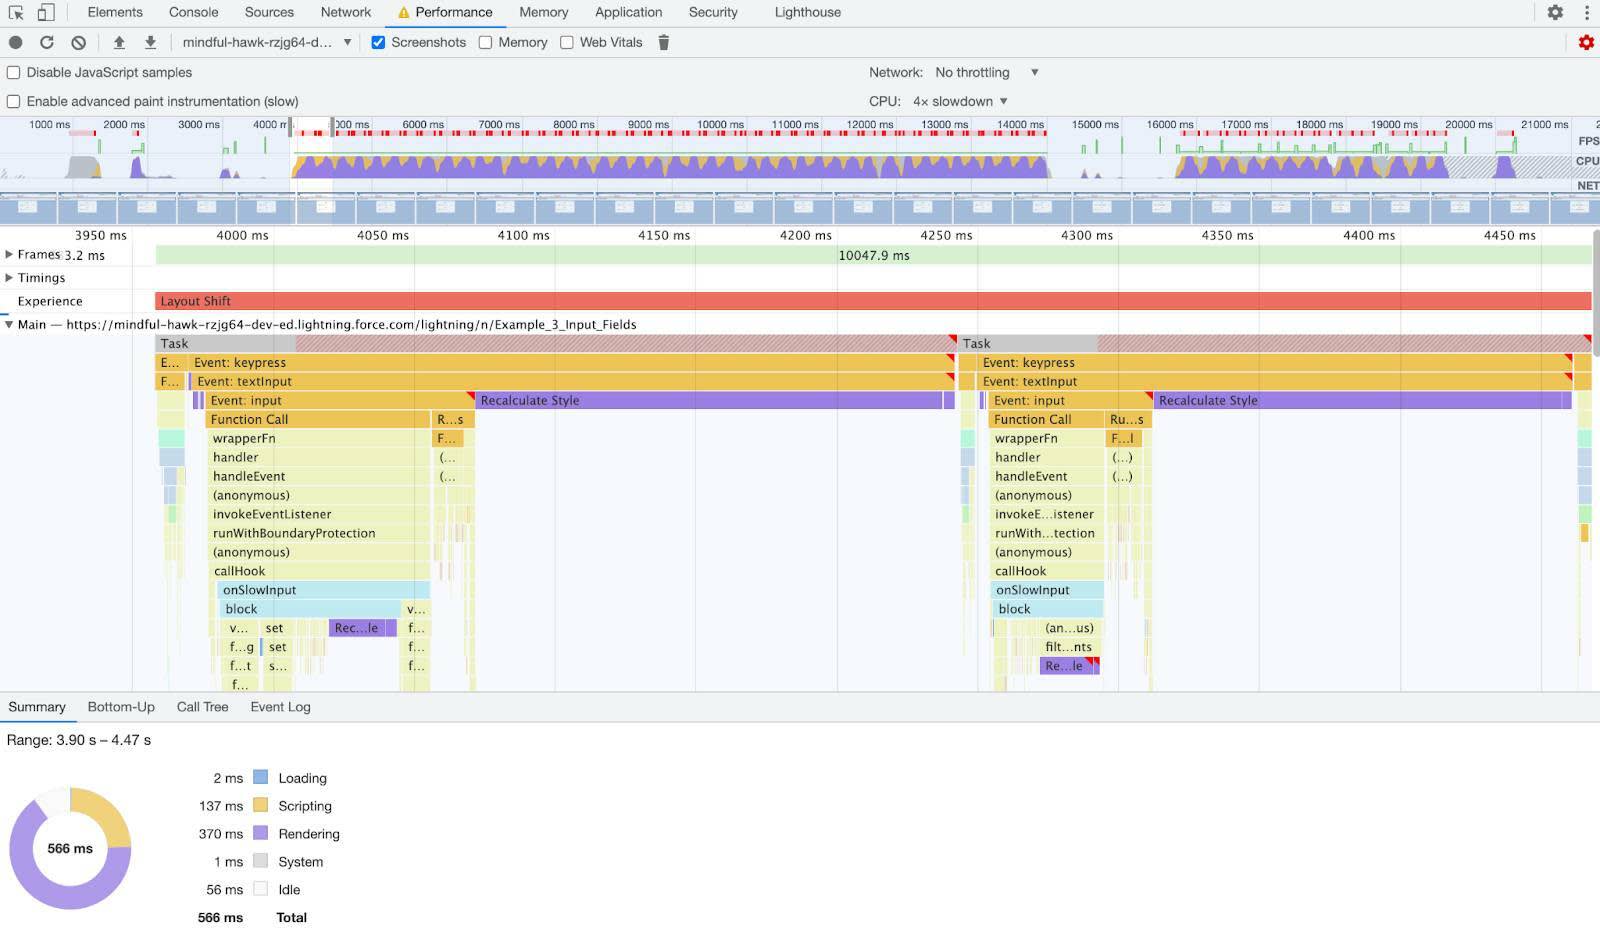
Look at the large Recalculate Style block. Something is causing an expensive recalculation of the CSS styles.
- Click one of the onSlowInput events to get the details in the Summary panel.

- In the Summary panel, click the example3_InputFields.js link to open it in the Sources panel.

The onSlowInput method makes a call to the block method. The block method is rendering a bunch of divs with randomized sizes causing the styles to be recalculated. That’s a problem.
The onFastInput method, line 166, is called from Input #2 field. It also makes a call to the block call but only after it is debounced. This shows how debounce helps. The best practice would be to use the debounce and update the block method to not cause the recalculation.
DOM Node Explosion
This next example can cause your browser to freeze. You can use the Task Manager mentioned in the first unit to start over.
- With the Bad Bunch app open, select Example 4: Table tab.
If your browser freezes, use the Chrome Task Manager to End Process and start over.

That’s a lot of data, but it should load quicker. Let’s record a profile as the page loads.
- Click Example 3: Input Fields to move off this tab.
- In the DevTools Performance panel, click
 .
.
- Now click Example 4: Table.
Wait for it to load.
- In the Performance panel, click Stop to end the recording and let it compile the data.

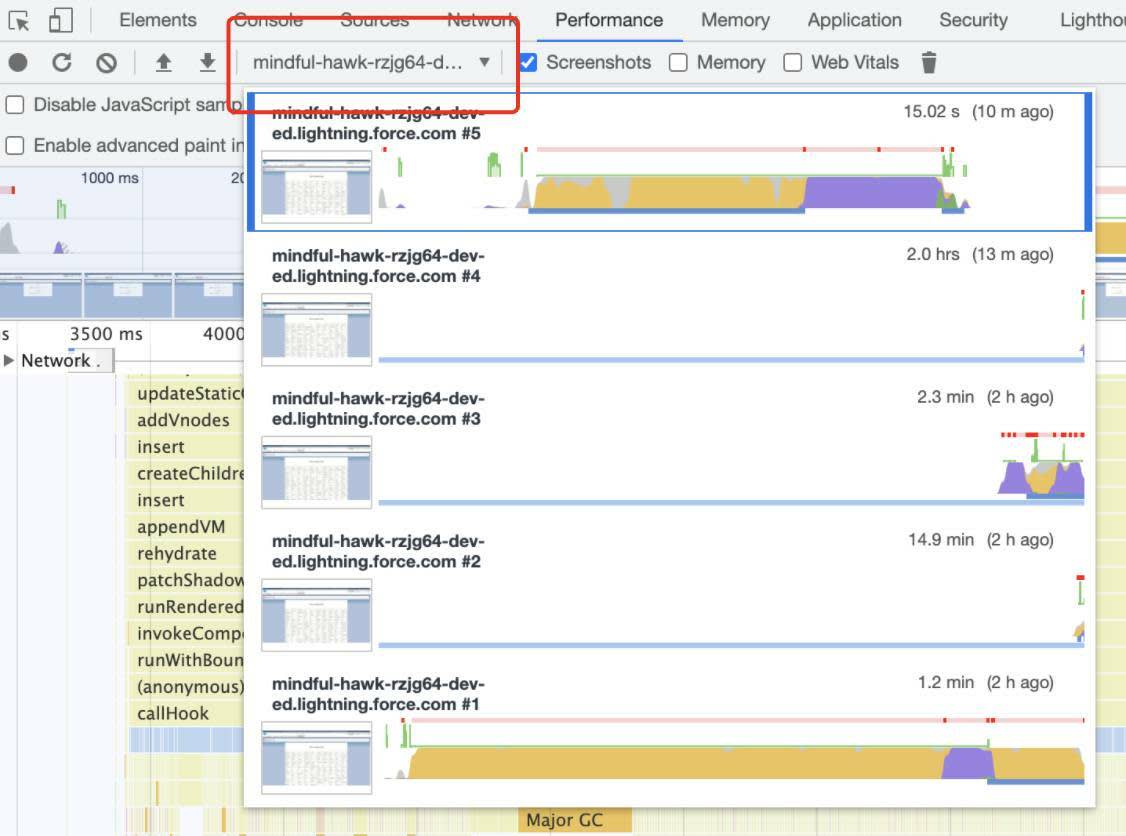
If you take multiple profile recordings, switch between recordings in the Performance menu.
Scrolling down in the Main section call stack will lead to a renderedCallback event that looks like it ran multiple times but actually ran once.
- Click the renderedCallback event to get the details in the Summary panel.

- In the Summary panel, click the example4_Table.js link to open it in the Sources panel.

There is a lot going on in this method. Digging in reveals that there’s a bunch of divs being created. Let’s look at another way to see this.
- Back on the Example 4: Table tab, right click in one of the table cells and select Inspect.
The Elements panel in DevTools opens to display the HTML markup of the table cell.
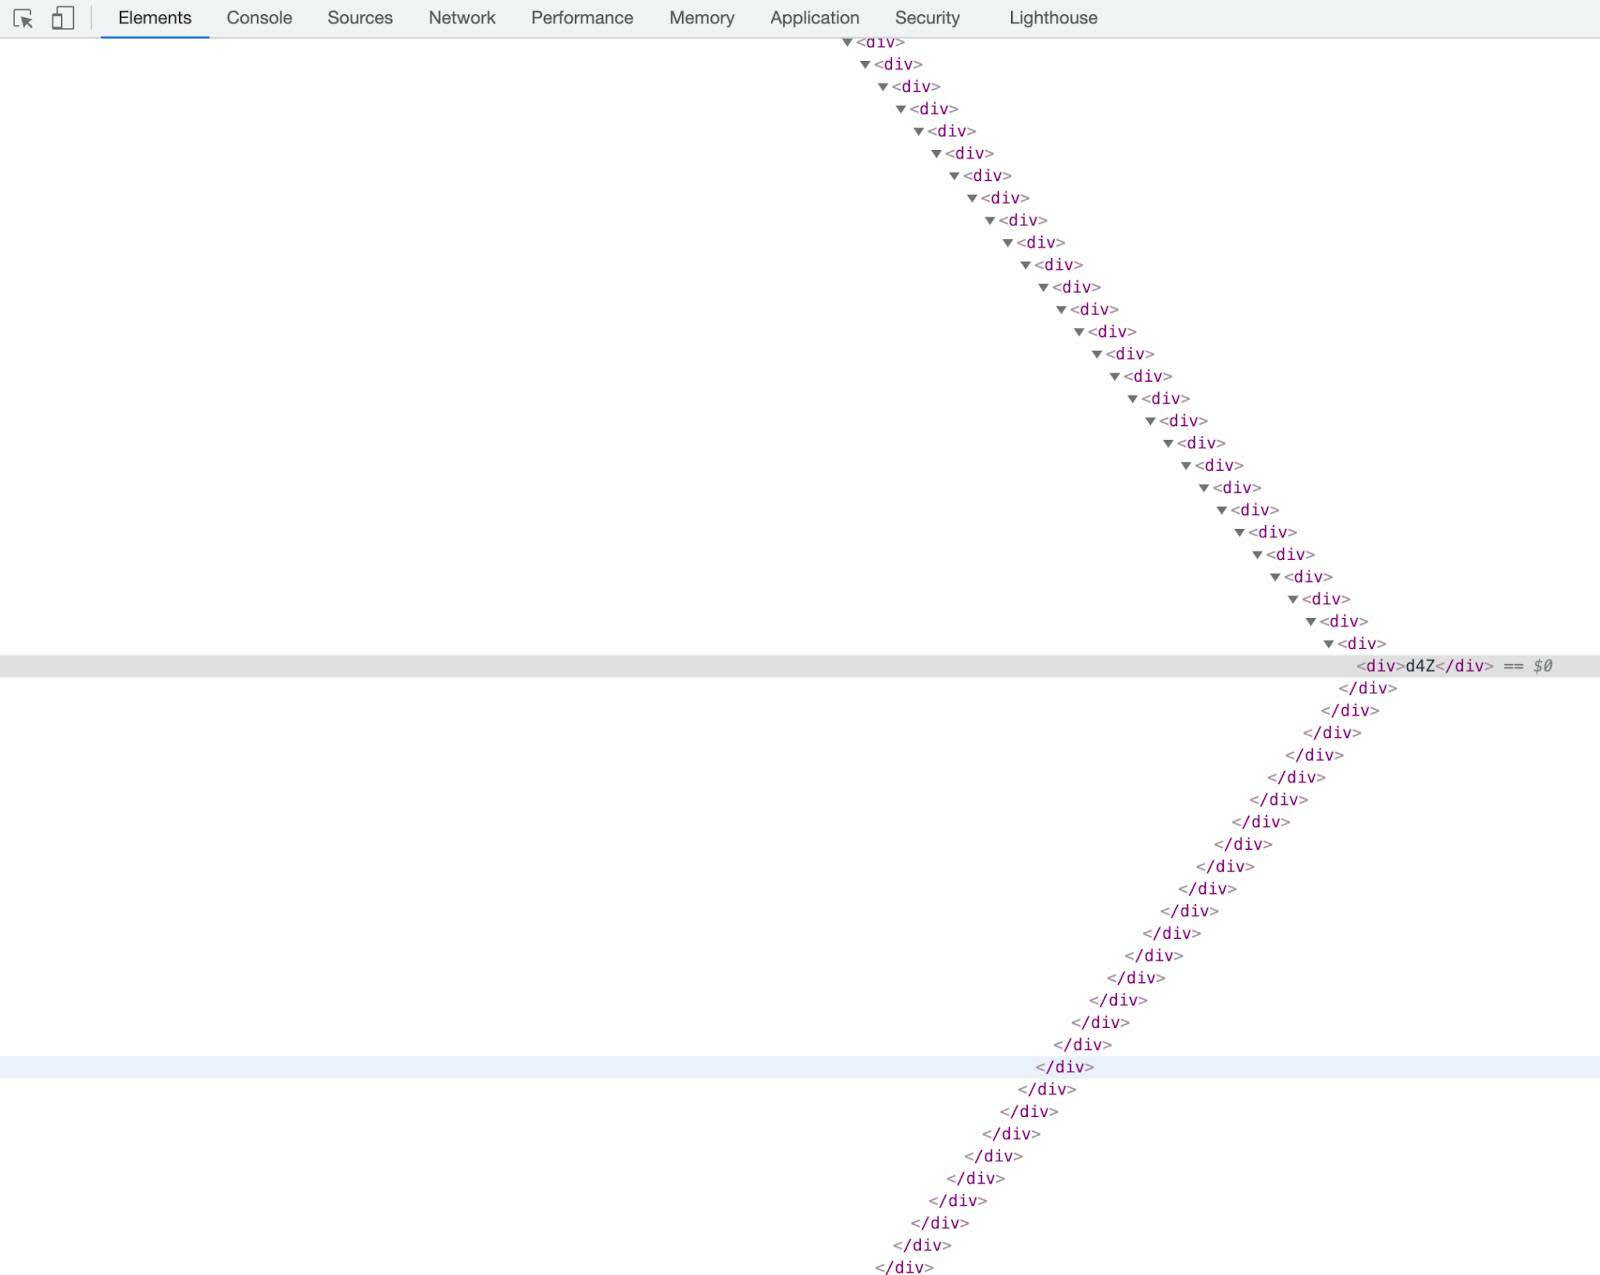
Now that’s a bunch of div tags. And that is just one of the table cells.
Let’s use the Performance monitor for a better way to look at this.
- In DevTools, click
 to expand the menu. Then click More tools and then Performance monitor.

The Performance monitor appears at the bottom of DevTools. The Performance monitor shows a real-time view of various aspects of a page’s load or runtime performance like CPU usage, JavaScript heap size, the total number of DOM nodes, and so on.

Take a look at the DOM Nodes! Over 400k nodes. Let’s see what this looks like on page load.
- In the Performance monitor unselect JS heap size and JS event listeners.
- Reload the page and watch the DOM nodes increase.
This is a possible issue for information-heavy pages. Not just data tables. This can become an issue with how Lightning Web Components are built and wired up. Components within components within components or components that dynamically generate other components or large numbers of HTML tags can add a lot of DOM nodes to the layout.
We have explored several ways of looking for performance issues with Lightning Web Components and even just Lightning pages in general. You now have new tools for your toolbelt and are better equipped to tackle performance problems.
Resources
- CSS Tricks Blog: The Difference Between Throttling and Debouncing
- Lightning Web Components Dev Guide: Use Third-Party JavaScript Libraries
- Read the Tea Leaves Blog: Browsers, input events, and frame throttling
- Salesforce Developers Blog: Lightning Web Components Performance Best Practices