Get Ready to Troubleshoot
Learning Objectives
After completing this unit, you'll be able to:
- Create performance profile recordings.
- Inspect the call stack to find issues.
- Demonstrate how to select a portion of a profile recording.
- Use the Chrome Task Manager to end processes.
Performance Troubleshooting Lightning Web Components
Performance comes from the perspective of how fast the site is. Experience page time (EPT) is a performance metric Salesforce uses in Lightning to measure page load time. The idea behind this metric is to time how long it takes for a page to load so it's in a “usable state” for a user to meaningfully interact with it. The goal for most pages is to be below 3 seconds.
Troubleshooting the performance of Lightning Web Components can take you in many directions. EPT is a high-level indicator of page performance. To go deeper into performance issues, there are three main areas to consider.
- Network performance
- Browser performance
- Page complexity and customization

Before You Begin
The developer tools in most browsers have similar features. We focus on Chrome DevTools in this module.
We assume that you have your Salesforce DX development environment set up and that you're comfortable using it to create Lightning web components and deploy them to an org. If you're not familiar with this process yet, complete the Quick Start: Lightning Web Components project before you continue in this module.
This module relies heavily on your experience with Chrome DevTools from the prior module in this trail: Lightning Web Components Troubleshooting. In fact, if you just completed that badge then your Playground should be ready to go with the code from GitHub that's needed for this module.
If you finished the Lightning Web Components Troubleshooting badge, verify that you have the latest code from GitHub.
- In Visual Studio Code open the troubleshoot-lwc project.
- Click File > Open (macOS) or File > Open Folder (Windows) and select the troubleshoot-lwc directory.
- Open the Command Palette by pressing Ctrl+Shift+P (Windows) or Cmd+Shift+P (macOS).
- Enter
git.
- Select Git: Pull.
- In the force-app/main/default directory, open the permissionsets directory.
- Verify the Bad_Bunch_Full_Access.permissionset-meta.xml file exists.
- Right-click the default folder under force-app/main.
- Select SFDX: Deploy Source to Org.
- Click View > Terminal.
- Assign the Bad Bunch Full Access permission set to the default user by running this command in the terminal:
sf org assign permset -n Bad_Bunch_Full_Access
- Skip to Start With a Clean Browser below.
Set Up Your Troubleshooting Environment
First, you need to set up a Trailhead Playground with some Lightning web components and prepare it for troubleshooting.
Ready to Get Hands-on with Lightning Web Components?
We don't have any hands-on challenges in this module, but you can practice the steps in your Trailhead Playground. Here's how to access your playground. First, make sure you are logged in to Trailhead. Then click your user avatar in the upper-right corner of this page and select Hands-on Orgs from the dropdown. Click Launch next to the org you want to open. Or if you want to create a new playground, click Create Playground.
Enable Debug Mode
This step makes troubleshooting code much easier. With Debug Mode enabled in the org the code is not minified. So, the variable names remain the same and the general structure of the code remains, making it much easier to troubleshoot.
- From Setup enter
Debug Modein the Quick Find box, and then select Debug Mode.
- Check the box next to your user.
- Click Enable.
Grab the Lightning Web Components from GitHub
- Complete the instructions in the GitHub repo readme.
- In Visual Studio Code, assign the Bad Bunch Full Access permission set to the default user by running the following command in the terminal.
sf org assign permset -n Bad_Bunch_Full_Access
Your environment is now ready to do some troubleshooting using the browser DevTools.
Start with a Clean Browser
- Open a Chrome browser in Incognito or Guest mode.
This ensures that Chrome runs in a clean state without extensions installed. Extensions might create noise in your performance measurements.
- Click Customize and control Google Chrome (
 ) and select New Incognito Window.
- Open your Playground.
- Ensure that Debug Mode is turned on for your user.
This will also display the EPT in the browser.


Fix Chrome browser freezing or crashing
The Lightning web component examples in this badge can cause your browser to freeze or even crash Chrome. There's a nifty tool that allows you to close an unresponsive tab. Let's take a look.
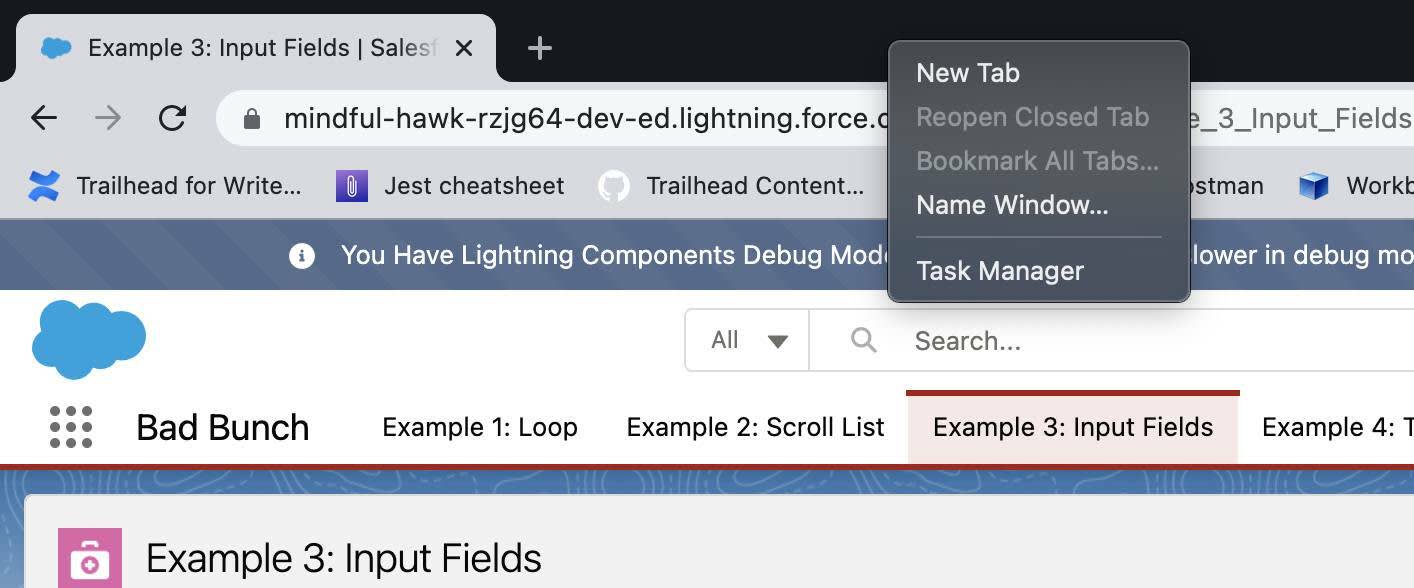
- Right-click in the blank area in the tabs section of the Chrome browser and select Task Manager.
- Click an item in the Task Manager to see the option to End Process.
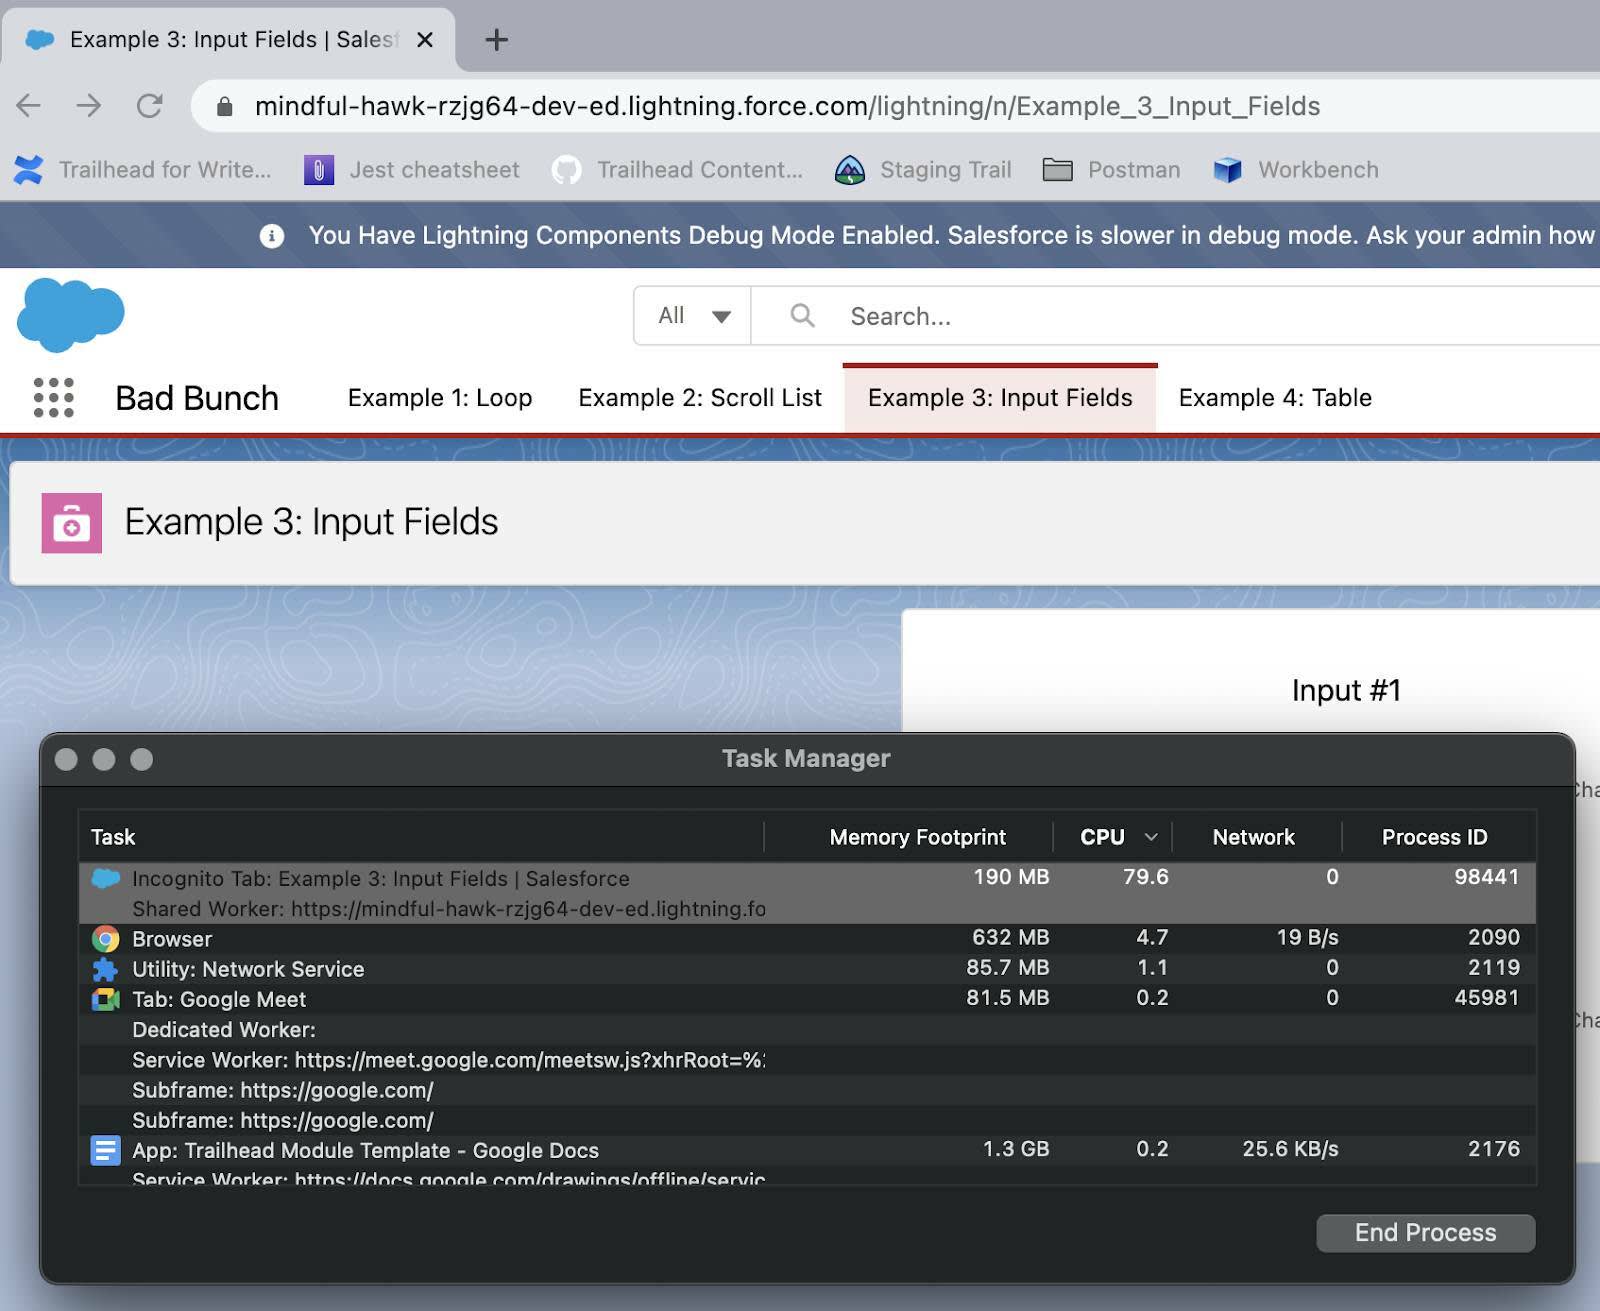
Now that we have a way to get out of a stuck process let's jump in.
Open DevTools Performance Tab
Let's look at the Bad Bunch app with the Chrome DevTools Performance tab.
- From the App Launcher (
 ) in your playground, find and open Bad Bunch.
- Right-click the browser window and click Inspect.
- Click Customize and control DevTools (
 ) and select the dock side you want to use. (Images in this module show DevTools undocked into a separate window.)

Having DevTools in a separate window gives you better access to all the data while troubleshooting.
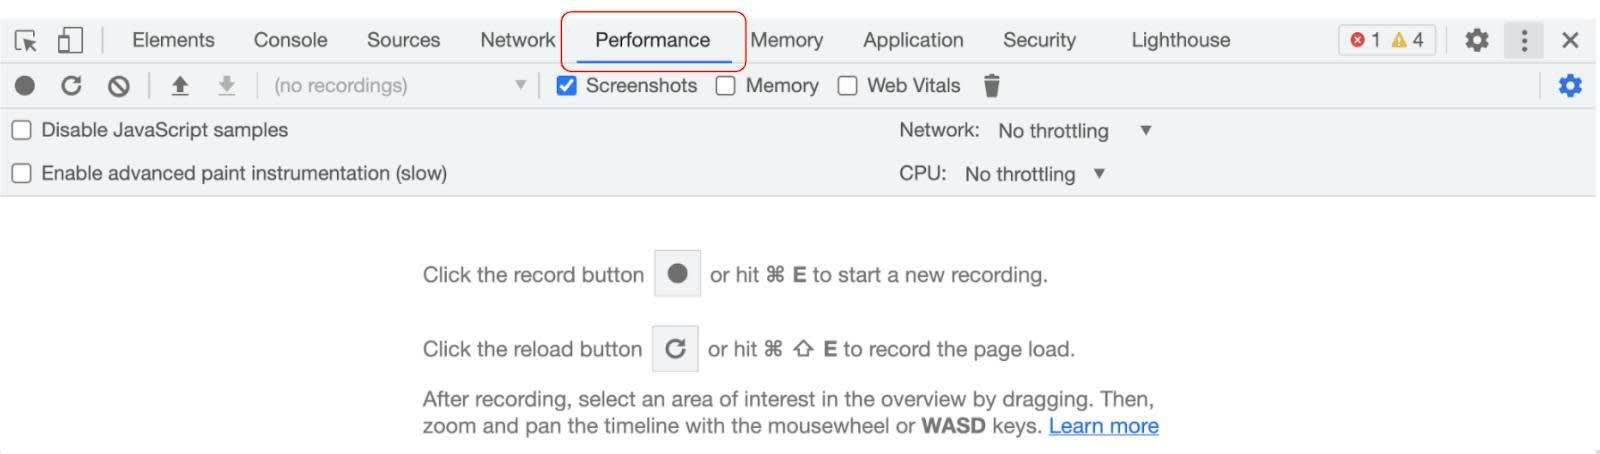
- Select the Performance tab.
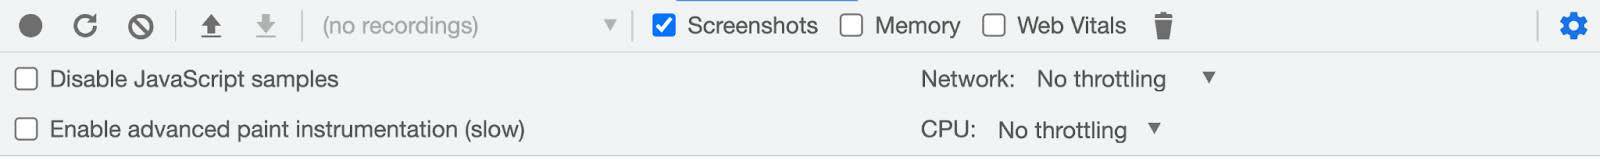
Performance Options
There are a lot of options and information that can be gathered in the Performance area. Here are some that we'll cover.
Button |
Action |
Description |
|---|---|---|
|
Record |
Starts a new profile recording of all page activity that occurs as a result of your interactions. |
|
Start profiling and reload page |
Starts a new profile recording as it reloads the page analyzing the performance of a page as it's loading. Automatically stops recording once the page is loaded. |
|
Clear |
Clears out all profile recordings. Be sure to save any profiles that you want for later analysis. |
|
Load profile |
Loads profiles that were previously recorded and saved. |
|
Save profile |
Saves a recorded profile. |
|
Show recent timeline sessions |
Lists profile recordings for this DevTools session. Use this to switch between recordings. Closing DevTools clears the recordings. Be sure to save profiles for future analysis before closing DevTools. |
|
Capture screenshots |
Captures screenshots of every frame while recording. Be sure to disable this when you are working with sensitive data and want to record the profile. |
|
Show memory timeline |
If turned on while viewing a recorded profile, displays memory metrics for that recording. |
|
Collect garbage |
Forces garbage collection while recording a profile. |
|
Capture settings |
Opens extra settings like throttling options for Network and CPU. |
|
Network throttling |
Under Capture settings, allows you to set the level of network throttling needed for troubleshooting. |
|
CPU throttling |
Under Capture settings, allows you to set the level of CPU throttling needed for troubleshooting. Throttling is relative to your computer capabilities. |


Record a Profile
- With the Bad Bunch app open, under the DevTools Performance tab, click Record (
 ).
).
Notice that the Record icon turns red and the status window displays Status Profiling and the Stop button.

- In the Bad Bunch app click Do Something.
Wait for it to display the time it took to execute. It should take a little while and the browser is basically locked while it performs the request.

- Now click Do Something Faster.
It will display the time much faster.

- In the Performance panel, click Stop in the status window.
The recording stops. Then the data is processed and the results displayed on the Performance panel.

That's a lot of information!
- The colors used in the CPU chart are used in the Summary panel under the charts.
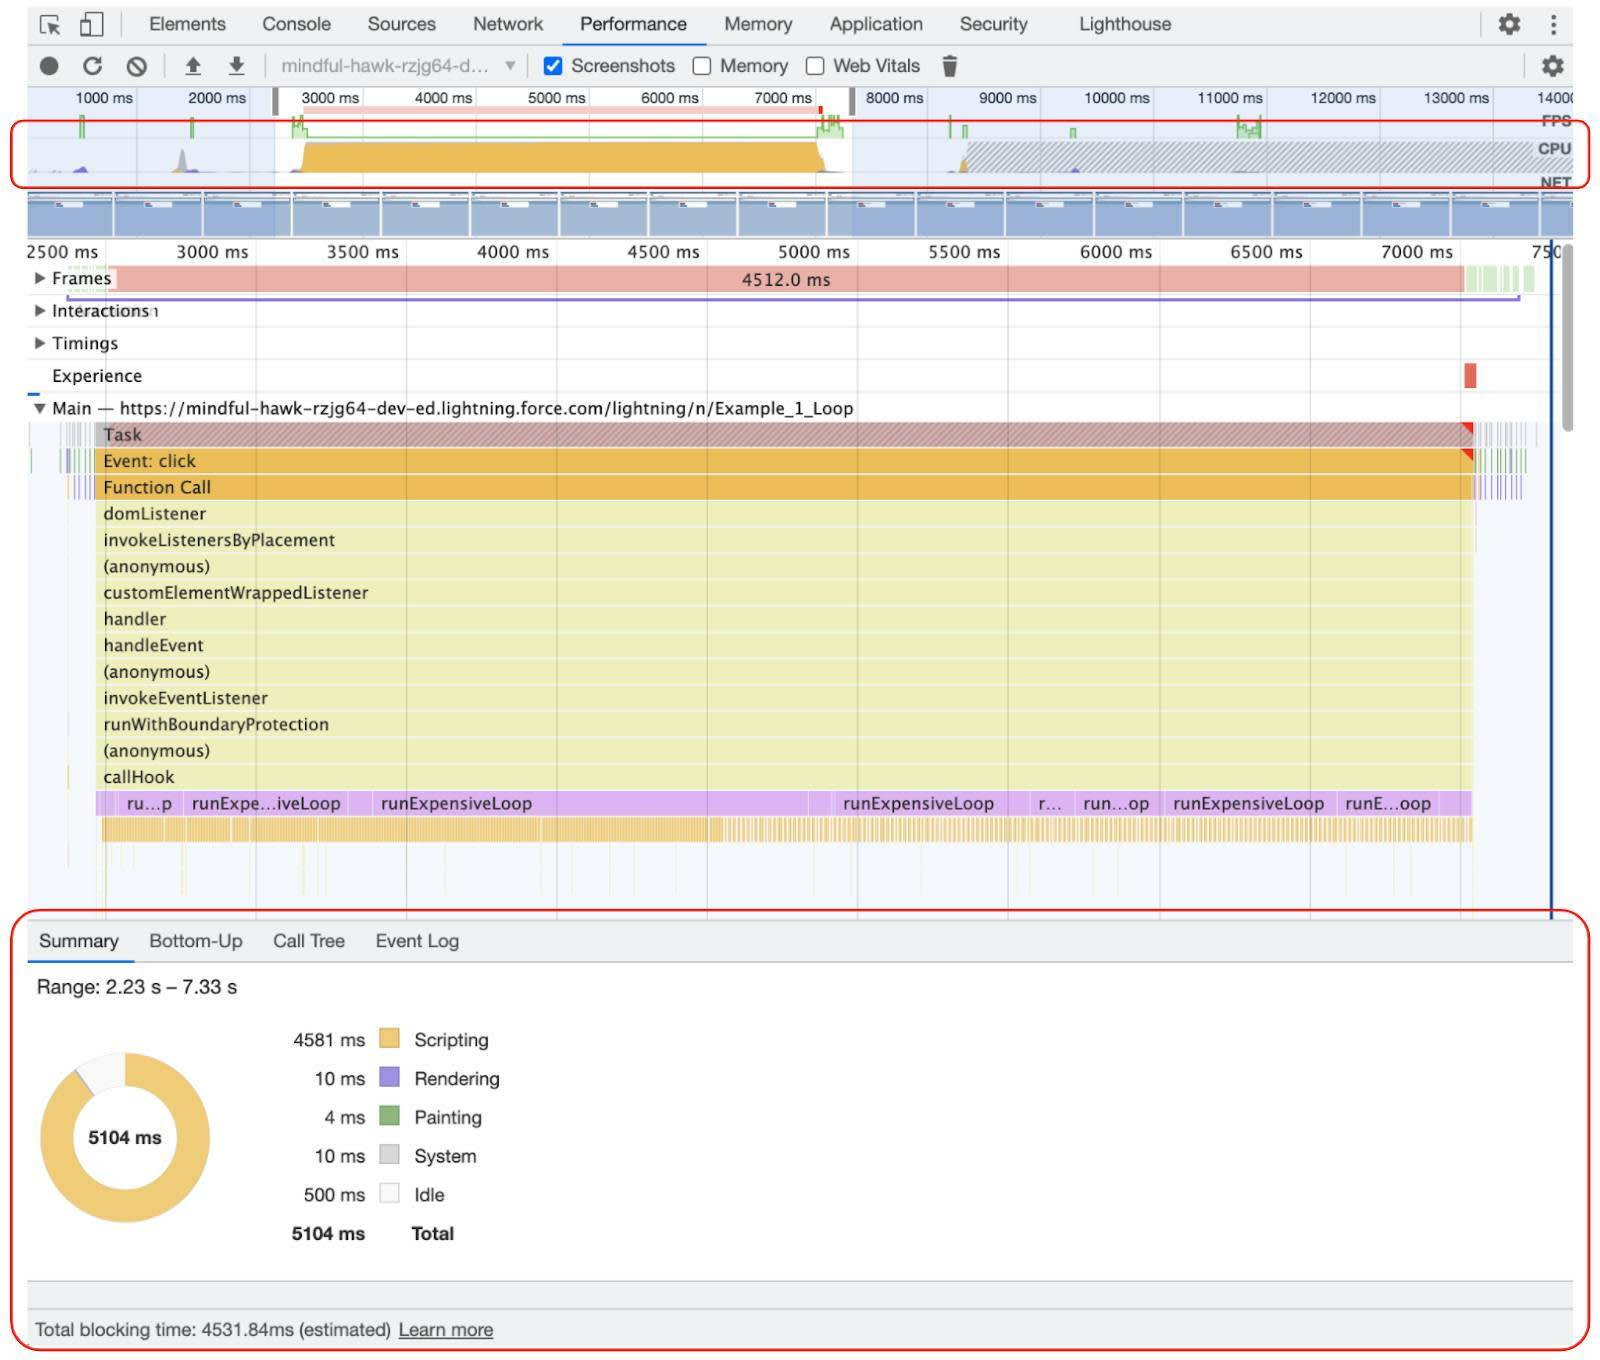
Notice the maxed-out color in the CPU chart. That's a strong indicator of a potential issue. Looking at the corresponding color in the Summary panel shows Scripting was maxed out.
- Open the Main section to see the JavaScript call stack of events as they were called.
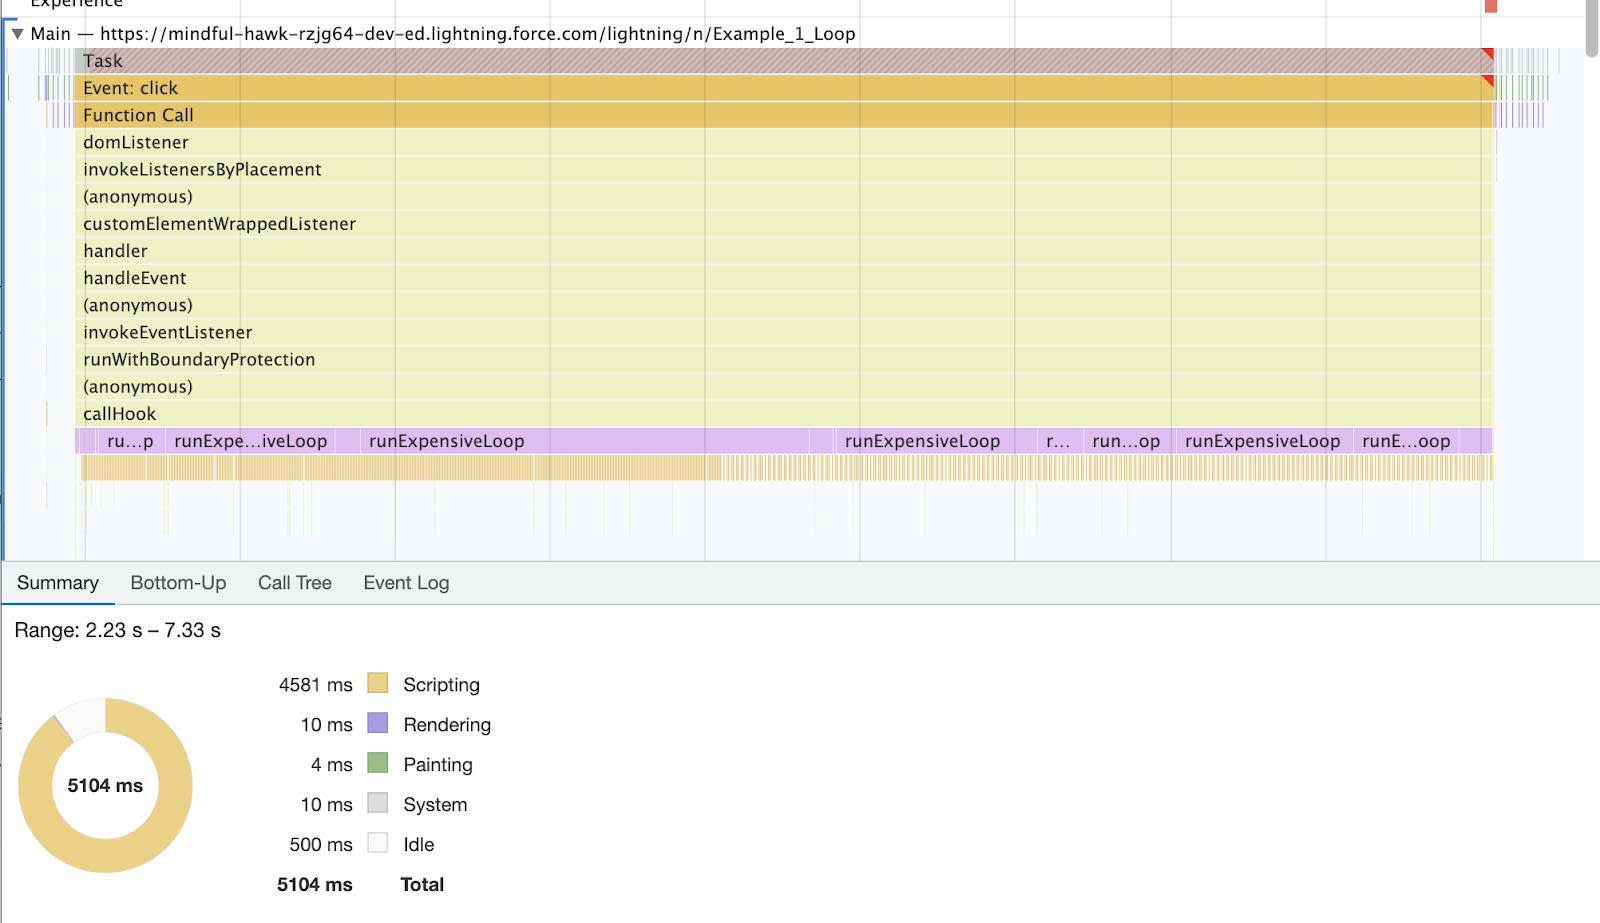
The bars are events and the size shows the time they took to execute. When stacked, the upper event caused the lower event. Understanding the single-threaded nature of JavaScript is fundamental to troubleshooting LWC performance.
- Select one of the events to display details in the Summary panel.
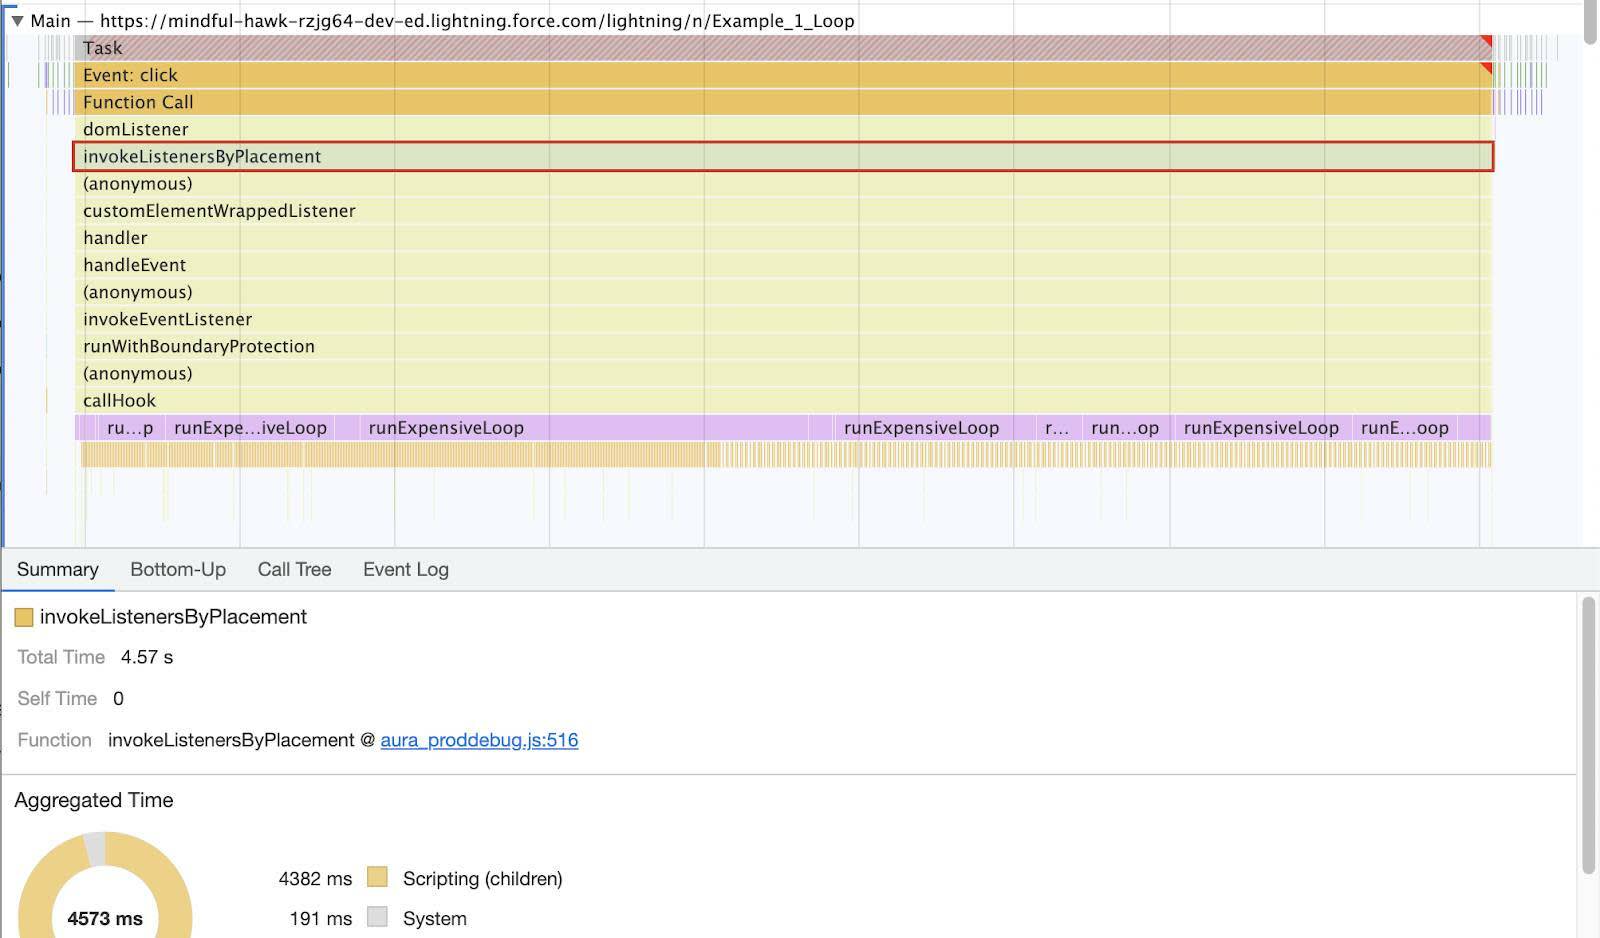
Notice that this particular one is the invokeListenersByPlacement aura event (it's in the aura_proddebug.js file on line 516). This is part of the Lightning base code, not what you're looking to troubleshoot.
- Select one of the runExpensiveLoop events.

It looks like it ran a bunch of times, but this can be misleading. DevTools uses heuristics to determine how to display the results. This is our code, though, not an aura event.
- In the Summary panel, click the link to the example1_Loop.js file; it takes you to the Sources panel with the code highlighted with execution time.

You can see from line 99 that parsing the JSON string in the loop is taking way too much time.
- Switch back to the Performance tab and be sure to click in a blank space in the Main section to clear the runExpensiveLoop selection.
- Next to the Summary tab select Bottom-Up.

This is another way to see what is taking the most time to run. The Bottom-Up panel only shows events for the selected portion of the recording. Let's take a look at the Do Something Faster button click.
Select the Portion of the Recording to Work With
- Move your mouse right or left in the Overview section (the area with FPS, CPU, and NET charts) to display the screenshot for that time in the recording.

- Click and drag your mouse across the section of the recording you want to select.
Select the area of the Do Something Faster button click.
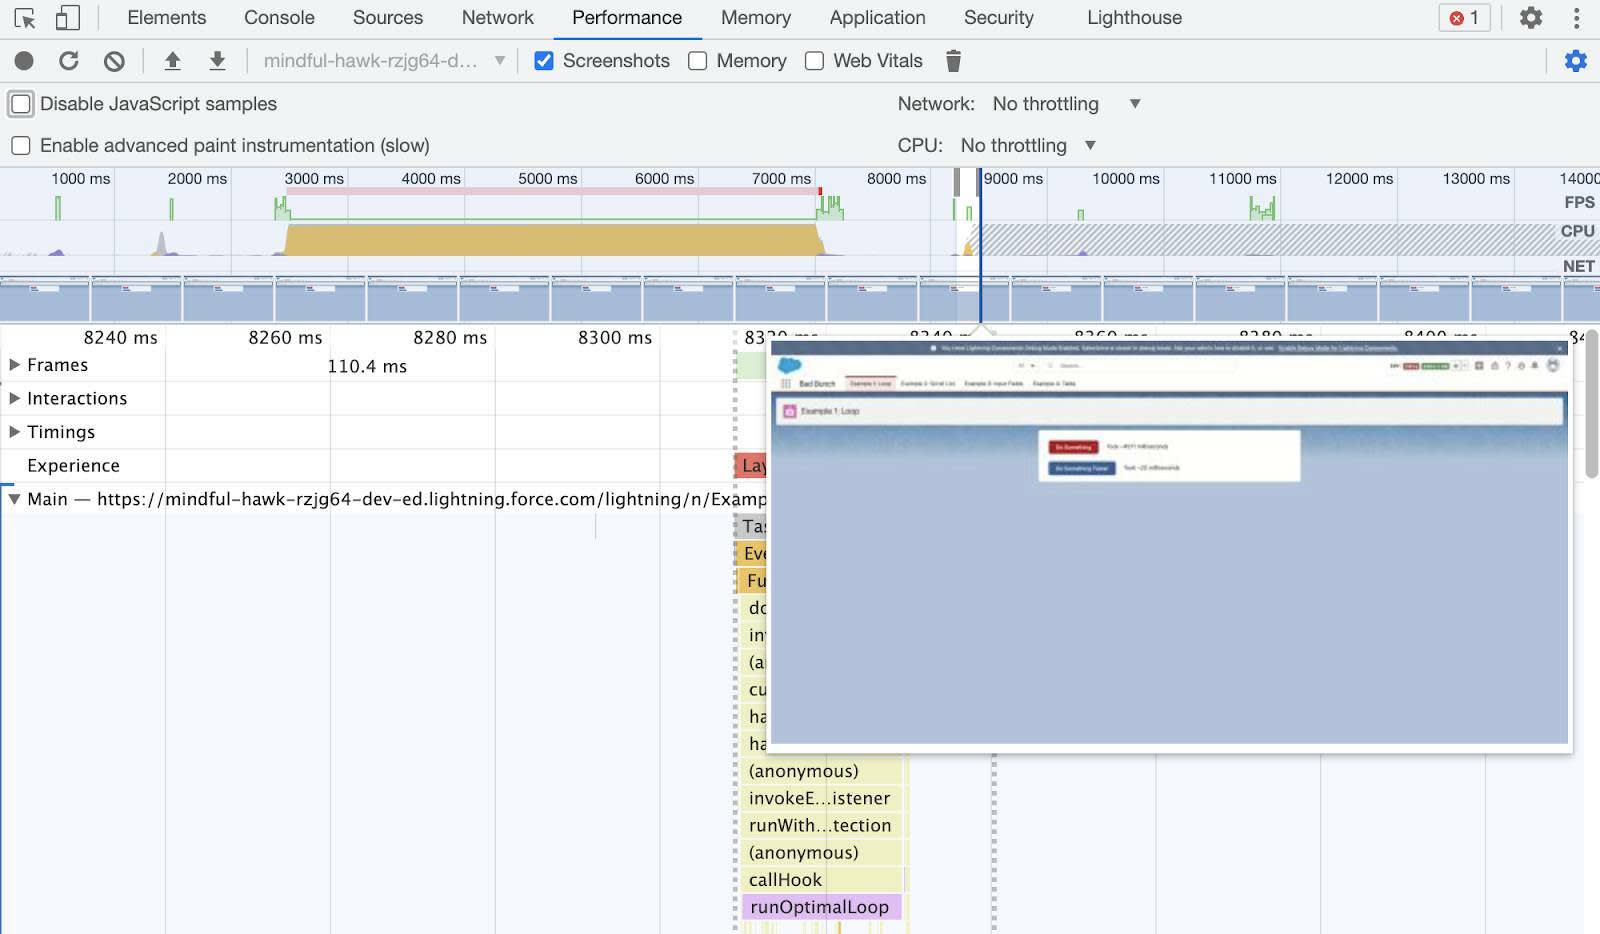
You can see it's a much smaller section of the recording.
- Click the runOptimalLoop event to see the details in the Summary panel. You may need to select the Summary tab if you are still displaying the Bottom-Up panel.
- Click the example1_Loop.js link to switch to the Sources panel again.

You can see runOptimalLoop is similar to runExpensiveLoop, except the JSON parsing happens outside theforloop on line 112. Running the parse only once outside theforloop on line 112 only takes ~0.1s as you can see in the side column. On line 99 where the parse was run over and over again in the loop, it took a total of ~4,343.3ms. That's a 4 MILLION percent increase when comparing the placement of the parse within the method! Your recording times might vary from these results.
- Click Save profile (
 ) to download this profile to save a copy, select a location for the saved JSON file, and click Save.
You can use Load profile ( ) to upload it later.
Let's take a look at some other Lightning web component examples in the next unit.
Resources
- Salesforce Developers Blog: Understanding Experienced Page Time
- Salesforce Developers Blog: Lightning Web Components Performance Best Practices
- Trailhead: Lightning Experience Performance Optimization
- Chrome Developers: Analyze runtime performance
- Chrome Developers: Performance features reference