Discover More IDX Workbench Dashboards
Learning Objectives
After completing this unit, you’ll be able to:
- Use Process Profiler to profile performance of each step of an OmniScript or an Integration Procedure.
- Use the Version Compare feature to compare OmniScript and Integration Procedure versions in an org.
- Use Test Console to run and analyze the results of Test Procedures.
Introduction
Earlier in this module, you learned about the Migration dashboard available in IDX Workbench. In addition to data migration, IDX Workbench gives you some useful features through the following dashboards.
- Process Profiler
- Version Compare
- Test Console
It’s time to dive deeper into these dashboard features. Vijay can’t wait to get into the weeds and become an IDX Workbench expert. So, let’s continue our learning journey by looking at each dashboard, one by one.
Use the Process Profiler Dashboard
The Process Profiler dashboard in IDX Workbench lets you view OmniStudio Tracking Service data for an OmniScript or Integration Procedure in a configured org.
The OmniStudio Tracking Service is an event-tracking service that captures details of actions that users perform. For example, you can track the time it takes to complete the actions in an OmniScript to identify process improvements. You must enable tracking for the OmniStudio components in your org before you run through your business flow to capture this tracking data. To learn more on how to enable tracking for the OmniStudio components, refer to the Resources section of this unit.
The Process Profiler dashboard has an Options panel and a Step Timing panel. Use the Options panel to configure and select an OmniScript or Integration Procedure in an org for which you want to view performance. The Step Timing panel is where you can see the performance data for your selected OmniScript or Integration Procedure.
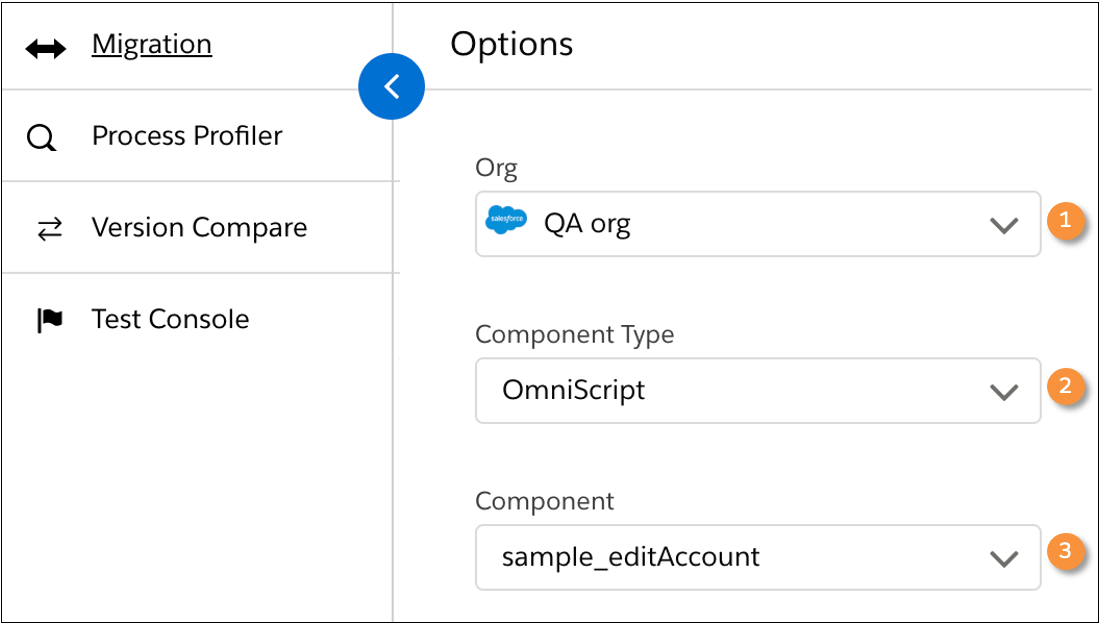
In the Options panel, select an org using the Org (1) dropdown list. Orgs configured in each project are listed here, or you can configure a new environment. Once you’ve selected the org, choose a Component Type (2) and a Component (3). The Component Type can be either an OmniScript or an Integration Procedure. Only those component types and components that have tracking data get listed.
The Process Profiler also gives you some optional fields to further filter and select the data.
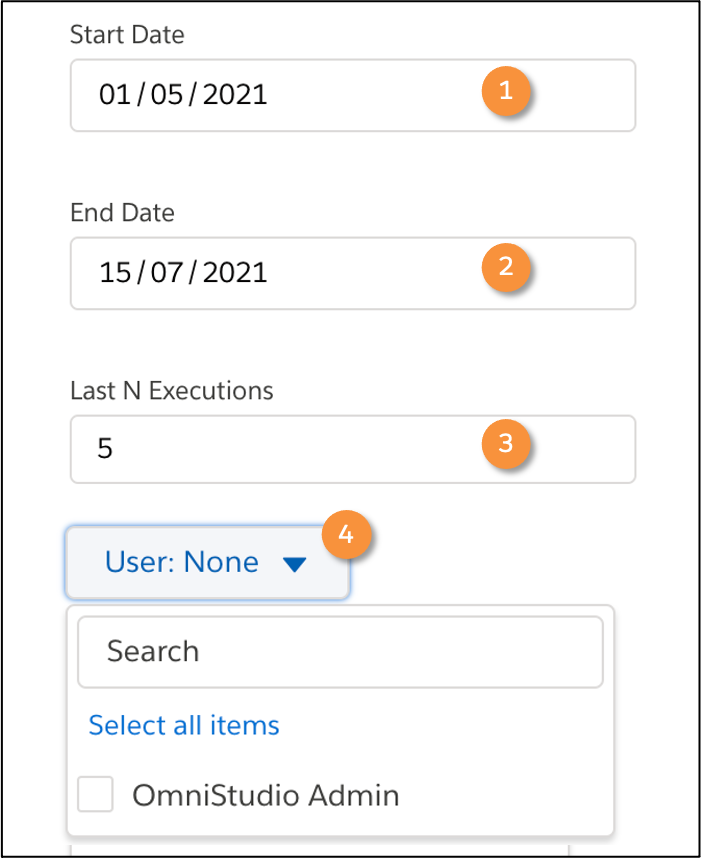
Use the Start Date (1) and the End Date (2) fields to filter the data by date. To limit the number of requests to be averaged, type an integer in the Last N Executions (3) field. You can also filter the data by users. Click the User (4) list and select the desired user names.
Based on your selections, you can view the performance data generated in the Step Timing panel.

To go to a step in the selected org, right-click the step name, and then click Open in Browser (1). For example, right-click the Data Mapper Turbo Action to open the Omnistudio Data Mapper that the step calls. For more details on the performance of a specific step, hover your mouse over any grid cell of that step until you see Click to View Details (2). Click the cell to view detailed information.
Here’s an example of the execution details generated for each step. These details contain information on Execution Stats, Configuration, and Data.
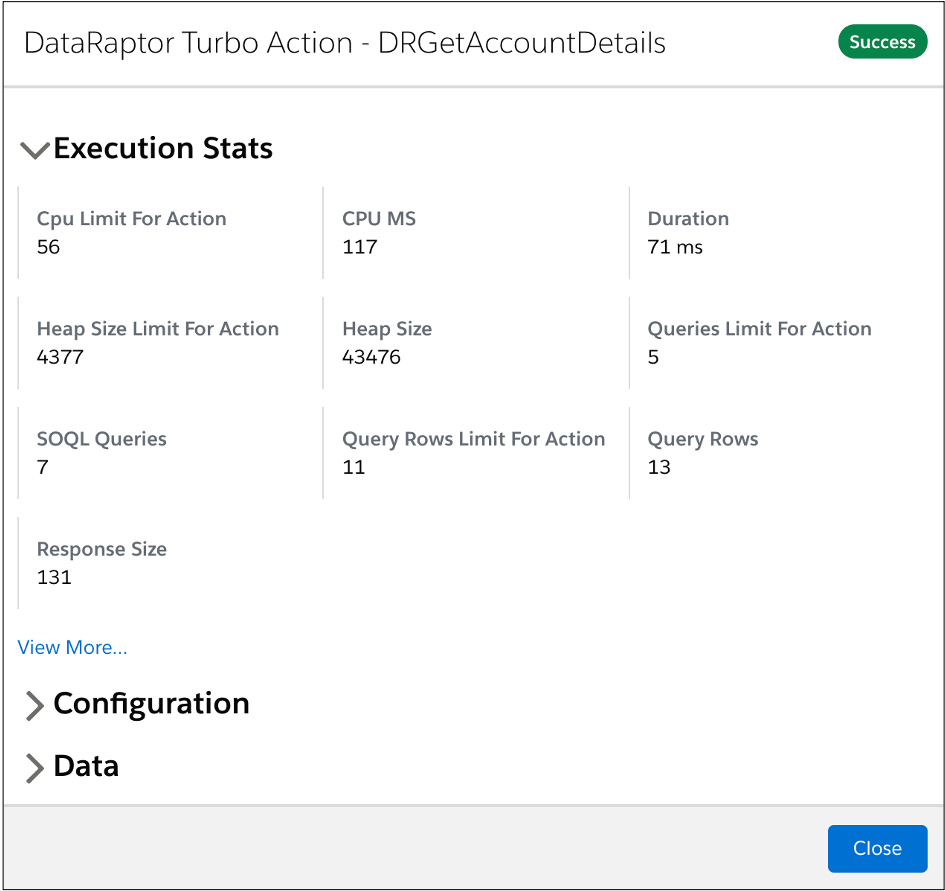
Similarly, you can use the Process Profiler dashboard to view execution details of any OmniScript or Integration Procedure instance in your org. Then, use this data to identify process improvements.
Use the Version Compare Dashboard
The Version Compare dashboard in IDX Workbench lets you compare two versions of an OmniScript or Integration Procedure in the same org. This dashboard has an Options panel and a Differences panel.
- Use the Options panel to select the object for which you want to compare versions.
- Use the Differences panel to view the result of the comparison.
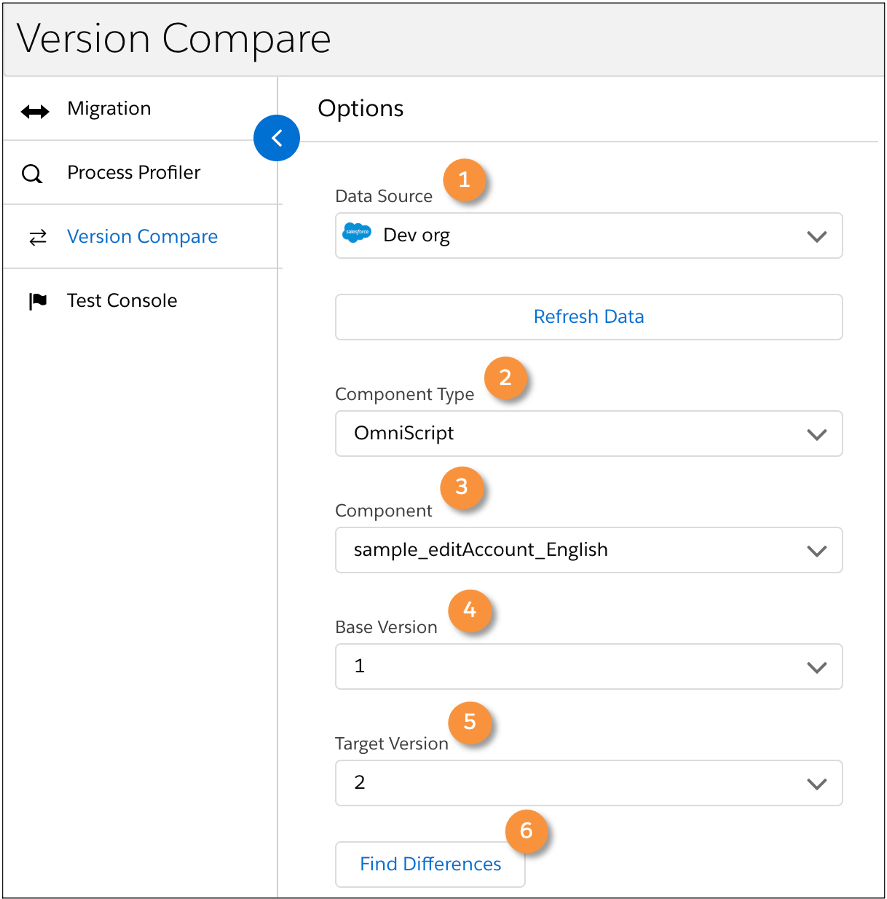
In the Options panel, select a Data Source (1) from the dropdown list. Orgs configured in a project are listed, or you can configure a new environment. Once you have selected the org, select a Component Type (2) and a Component (3). The component type can be either an OmniScript or an Integration Procedure. Then select a Base Version (4) and a Target Version (5). Lastly, click Find Differences (6).
You can see the differences between the base and target versions in the Differences panel. Items in the base version are highlighted in green, and those in the target version are highlighted in red. You can view the JSON code of the component in the source org by clicking the View Source button.

You can use this data to merge two versions of an OmniScript or Integration Procedure into a single version.
Use the Test Console Dashboard
The Test Console dashboard in IDX Workbench lets you run Test Procedures and analyze the results of the tests in the selected org.
A Test Procedure is an Integration Procedure that performs a unit test. You can use a Test Procedure to unit test the actions available in an Integration Procedure, such as a Data Mapper, Calculation Matrix, Remote, or Integration Procedure action.
The Test Console dashboard consists of an Options panel and a Test Results panel.
- Use the Options panel to select the Test Procedures you want to run.
- Use the Test Results panel to view the test results.

In the Options panel, select an org from the Test User (1) dropdown list. Orgs configured in each project are listed, or you can configure a new environment. Once you’ve selected the org, click Get Tests (2). A list of active Test Procedures appears.
Select the check box next to each Test Procedure you want to run. To run all Test Procedures, check All Tests (3). Then, click Actions > Start Test (4) in the bottom right corner of your application screen to run the Test Procedures.
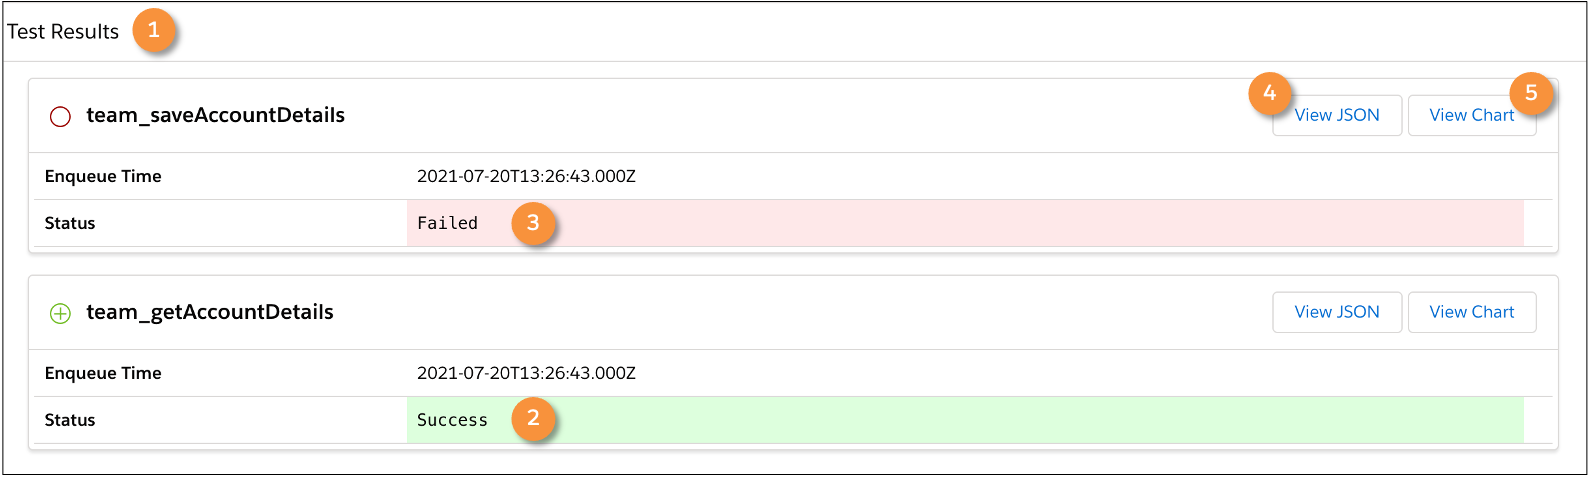
When tests are complete, results appear in the Test Results (1) panel. If a test passes, the Status shows as Success (2), and if it fails, the Status shows as Failed (3). To view the JSON code of the Test Procedure, click View JSON (4), and to display a chart of the run time for the Test Procedure steps, click View Chart (5).
Vijay is all set to use IDX Workbench for his project requirements. He loves that he can profile execution details and run unit tests before committing his changes to source control... and all the comfort this brings. Let's take his happiness a notch higher by introducing Vijay to another powerful metadata migration tool in the next unit - IDX Build Tool.