Troubleshoot Network Issues
Learning Objectives
After completing this unit, you'll be able to:
- Use Chrome DevTools to check Lightning web component network issues.
- Review requests and responses in the Network panel.
Network Troubleshooting Lightning Web Components
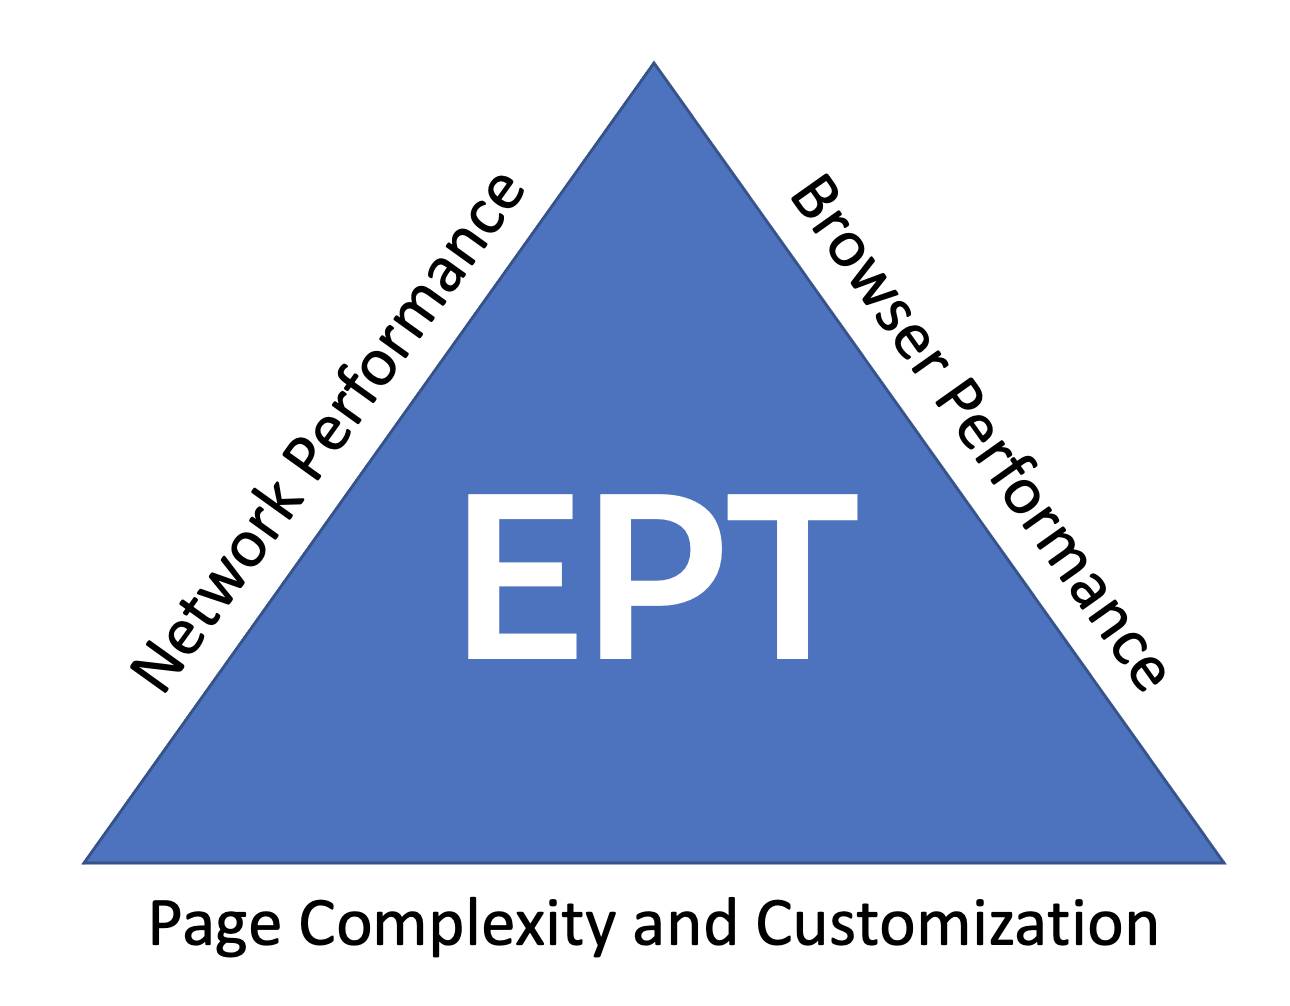
Performance, how fast a site is, depends on many factors: server resources, client resources, browser speed, and so on. Many sites rely on page load time alone to measure performance. At Salesforce, when we measure Lightning performance, we focus on the performance experienced by the user. Experience page time (EPT) is a performance metric Salesforce defined to measure how long it takes for a page to load and be ready for a user to interact meaningfully with it.
Troubleshooting the performance of Lightning web components can take you in many directions. EPT is a high-level indicator of page performance. To go deeper into performance issues, there are three main areas to consider.
- Network performance
- Browser performance
- Page complexity and customization
In this module, we look at network performance and browser performance, specifically browser memory.
Before You Begin
The developer tools in most browsers have similar features. We focus on Chrome DevTools in this module.
We assume that you have your Salesforce DX development environment set up and that you're comfortable using it to create Lightning web components and deploy them to an org. If you're not familiar with this process yet, complete the Quick Start: Lightning Web Components project before you continue in this module.
This module relies heavily on your experience with Chrome DevTools from prior modules in the Troubleshoot Lightning Web Components trail. In fact, if you just completed those badges, then your Playground should already have the code from GitHub that you need for this module. Follow these steps to confirm that you have the latest code from GitHub.
- In Visual Studio Code open the troubleshoot-lwc project.
Click File | Open (macOS) or File | Open Folder (Windows) and select the troubleshoot-lwc directory.
- Open the Command Palette by pressing Ctrl+Shift+P (Windows) or Cmd+Shift+P (macOS).
- Enter
git. - Select Git: Pull.
- In the force-app/main/default directory, open the permissionsets directory.
- Verify that the Bad_Net_Full_Access.permissionset-meta.xml file exists.
- Right-click the default folder under force-app/main.
- Select SFDX: Deploy Source to Org.
- Click View | Terminal.
- Assign the Bad Net Full Access permission set to the default user by running this command in the terminal:
sf org assign permset --name Bad_Net_Full_Access - Skip to Start with a Clean Browser below.
Set Up Your Troubleshooting Environment
First, if you haven't already completed the Lightning Web Component Troubleshooting module, you need to set up a Trailhead Playground with some Lightning web components and prepare it for troubleshooting in this module.
Ready to Get Hands-on with Lightning Web Components?
We don't have any hands-on challenges in this module, but you can practice the steps in your Trailhead Playground. Here's how to access your playground. First, make sure you are logged in to Trailhead. Then click your user avatar in the upper-right corner of this page and select Hands-on Orgs from the dropdown. Click Launch next to the org you want to open. Or if you want to create a new playground, click Create Playground.
Enable Debug Mode
This step makes troubleshooting code much easier. With Debug Mode enabled in the org, the code is not minified. So, the variable names remain the same and the general structure of the code remains, making it much easier to troubleshoot.
- From Setup enter
Debug Modein the Quick Find box, and then select Debug Mode. - Check the box next to your user.
- Click Enable.
Grab the Lightning Web Components from GitHub
- Complete the instructions in the GitHub repo readme.
- In Visual Studio Code, assign the Bad Net Full Access permission set to the default user by running the following command in the terminal.
sf org assign permset --name Bad_Net_Full_Access
Your environment is now ready to do some troubleshooting using Chrome DevTools.
Start with a Clean Browser
- Open a Chrome browser.
- Click the Customize and control Google Chrome icon (
 ) and select New Incognito Window. This ensures that Chrome runs in a clean state without extensions installed. Extensions might create noise in your performance measurements.
 - Open your Trailhead Playground.
- Ensure that Debug Mode is turned on for your user and EPT is displayed below the Debug Mode banner.


Troubleshoot a Slow Response Component
- From the App Launcher (
 ) in your Trailhead Playground, find and open Bad Network.
 - In the Bad Network app, click +1 to try to increase the number a few times.
It's taking way too much time to just increment the number. Let's use the DevTools Performance Tab to start troubleshooting. - Right-click the browser window and select Inspect (or click F12) to open DevTools.
- Click the Customize and control DevTools icon (
 ) and select the dock side you want to use: Undock into separate window, Dock to left, Dock to bottom, or Dock to right. (Images in this module show DevTools undocked into a separate window.)

Having DevTools in a separate window gives you better access to all the data while troubleshooting.
- In the DevTools menu select the Performance tab.
- In the Performance menu, click the Record icon (
 ) to start recording a profile.
 - In the Bad Network app, click +1 to increase the number again.
Wait for the number to update. - In the Performance panel, click Stop to end the recording and let the Performance panel compile and display the data in a timeline.
Let's Look at the Performance Data
- Notice the long blue line in the NET timeline chart below the FPS and CPU charts.

- Expand the Network section (on the left). Notice the aura call starting between 2000 ms and 2500 ms, aligned with the blue line in the Net chart section.
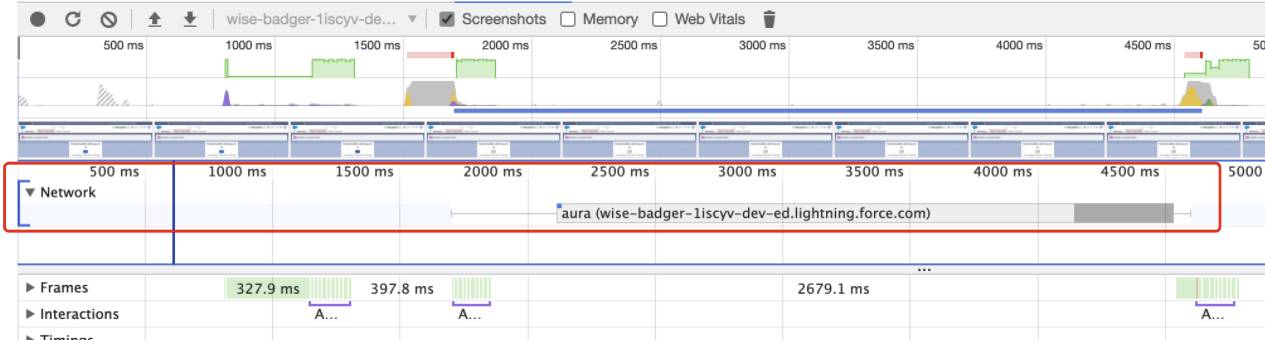
- Hover over the aura call to see the request info.

Notice the time stamp (2.90 seconds in this case) and the name of the request.
The Performance panel got us to this point showing us the long running network request. To get more detail we'll use the Network panel.
The Network Panel
Like the Performance panel, the Network panel has a lot of options available for investigating and troubleshooting. We cover only a few here. Check the Resources to dig deeper into what the Network panel has to offer.
Network Log
The Network panel records all network activity in the Network Log.

Each row of the Network Log represents a resource. The resources are listed chronologically from first to last by default. DevTools logs network activity only while it's open.
Each column contains information about a resource.
- Name: Clicking the resource name displays resource details
- Status: HTTP response code
- Type: Resource type
-
Initiator: What caused the resource request
Clicking the initiator opens the corresponding source code. - Time: How long it took to run the request
-
Waterfall: Graph of different stages of the request
Hover over to display a breakdown of the request.
Inspect Response Details
- Select the Network tab.

Select the Fetch/XHR filter to see only XMLHttpRequest (XHR) requests.
- Click the
aura.ApexAction.execute=1resource name to open the resource details.
The resource details opens displaying the previously selected tab. - Click the Response tab to see the response received from the server.

The response can come in a couple of different formats. In this case it's a large JSON (JavaScriptObjectNotation) response.
- Click the Timing tab to see a breakdown of network activity.

Notice Waiting for server response with the long green bar. That represents the wait time for the server to respond: the time between the browser requesting a page and receiving the first byte of information from the server. In this case, Waiting for server response is 3.83 seconds.
- Click the Initiator tab to view the request call stack.
DevTools filters the initial view to show only the most meaningful items (frames), the longest running calls, for example. Click the Show more frames link to see all items in the call stack.
Looking at the stack, we can see thatincreaseNumcalledlongAsyncFetchin the example1_IncreaseNumber.js file. - In the Initiator panel, click the example1_IncreaseNumber.js link to open the example1_IncreaseNumber.js file in the Sources panel.

The highlighted times in the code line number column represent only the time that the browser was engaged with the call, not how long the call was. You may need to scroll the code window to see theasync longAsyncFetchmethod.
On line 84, theincreaseNum(event)method callslongAsyncFetch()with anawaitoperator. That causes the javaScript to wait for the long response. Similarly, in the longAsyncFetch() method there is a call to theapex_generateJSONRecords_defaultmethod usingawaitto wait for the response before continuing.
Now we know that the reason it takes so long to increment the number is that one (or both) of the await operators causes the code to wait for a response. We need to either remove the await operator so that the process can run in the background, or modify the Apex code to run faster.
Next we look at a client-side browser memory issue.