Investigate Memory Issues
Learning Objectives
After completing this unit, you'll be able to:
- Use the Memory panel to track memory use.
- Access Performance monitor to monitor JS heap size and JS event listeners.
Crashing the Browser
The next example has the potential to crash your browser. Memory leaks in the client browser can slow the browser experience to the point of crashing it.
Fix Chrome Browser Freezing or Crashing
The Lightning web component examples in this module can cause your browser to freeze, but there's a nifty tool that you can use to close an unresponsive tab.
- In the Chrome browser's tabs section, right-click in the blank area and then select Task Manager.

- Click an item in the Task Manager. The End process button becomes active.

- Close Task Manager.
Now we have a way to get out of a stuck process.
Let's look at another bad example and how to troubleshoot it.
Excessive Event Listeners
- With the Bad Network app open, select Example 2: Count Clicks.
- Click Click Me repeatedly until the count response slows. The count is erratic and doesn't line up with the number of clicks. The color changes too. Let's use the Performance monitor to investigate this.
- Refresh the page.
- In DevTools, click the Customize and control DevTools icon (
 ) to expand the menu, and then click More tools > Performance monitor.

The Performance monitor tracks performance over time. We can monitor changes as we interact with the page.
- Select the JS heap size and JS event listeners options so they display results.

Notice the number of JS event listeners. The graphs can take a little time to display changes in the page. Keep an eye on the CPU usage, JS heap size, DOM Nodes, and JS event listeners as we continue.
- Click Click Me several times and notice that the CPU usage stays flat. DOM Nodes also stays flat. But JS heap size and JS event listeners are growing considerably.

Let's explore the information DevTools provides to help with tracking the JS heap size.
Use the Memory Panel
- Close the Performance monitor.
- In the DevTools menu, select the Memory tab.

- Refresh the page to start with a fresh example.
This allows you to capture a comparison baseline in a snapshot. - In the Memory panel, click Take snapshot.
- Wait for the snapshot to build and display. (This can take a few minutes depending on your browser speed.)

- Click Click Me until it slows down as it did earlier.
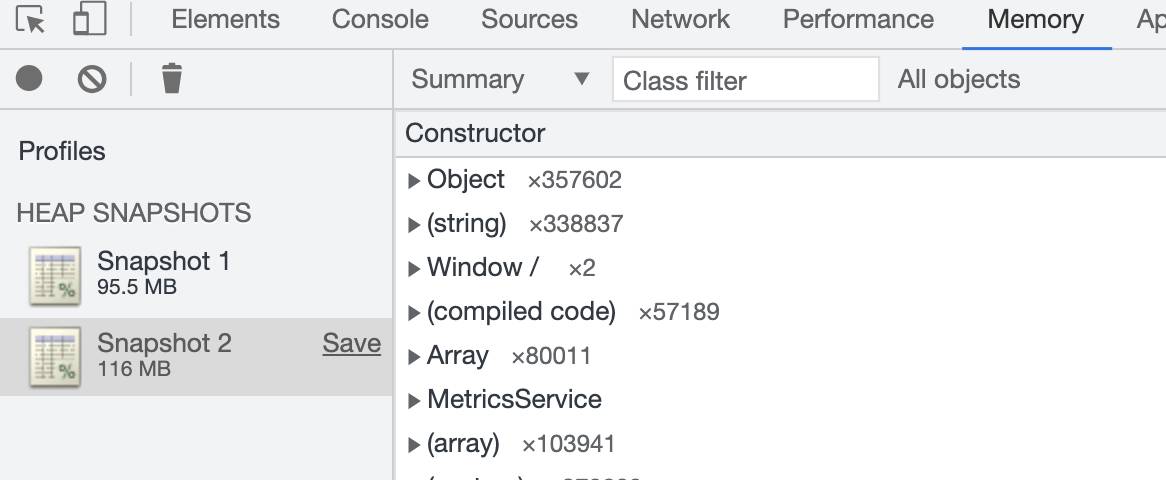
- Select the Profiles header and click Take snapshot to create a new snapshot.
- Wait for the snapshot to build. It's displayed under the first snapshot. The size increased by 20.5 MB from Snapshot 1 (95.5 MB) to Snapshot 2 (116 MB). Your snapshot sizes may be different from these.
Let's Compare the Two Snapshots
- In the Memory menu, from the Perspective list (currently set to Summary) select Comparison.

By default, Chrome compares to the previous snapshot, but you can select a different snapshot to compare to by selecting from the dropdown above the data. Each row shows the difference per item between the two snapshots.

- Select the Size Delta column header to sort by size delta. Clicking the header cycles through sort options.
- Sort from largest to smallest.
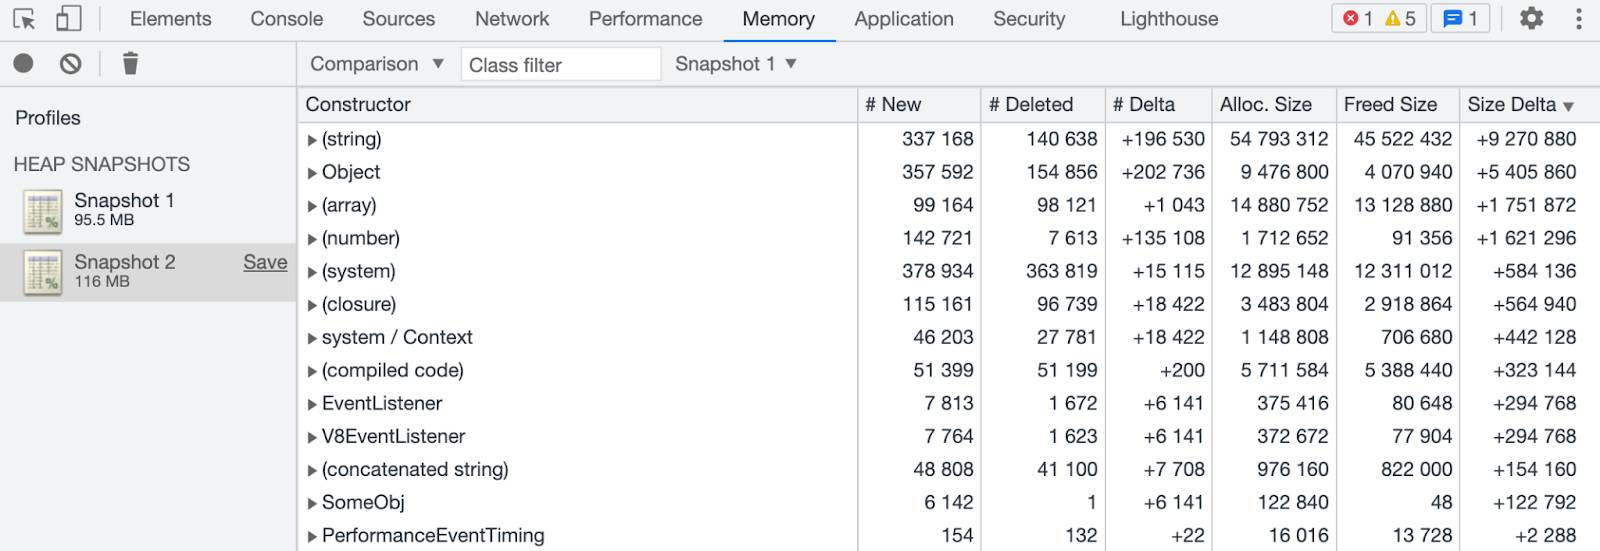
Scroll down the Constructor column and notice that there are mostly system items before the SomeObj constructor. In this case, 6,142 SomeObjs were created. That's a lot.
- Expand SomeObj to open it and see all the instances of SomeObj.

The JavaScript constructor of the SomeObj in memory is listed for each SomeObj instance. In this case, it's the example2_CountClicks.js file at line 63.
- Select one SomeObj to view its details in the Object pane. (The Object pane is below the Constructor pane and Retainers pane.)

In the Object pane details, on the second line, the first context shows the file and location of the call to generate the Object: example2_CountClicks.js at line 81.
- Click the example2_CountClicks.js link to open the file in the Sources panel.

Line 81 is in the listenForEvent method, which creates a new instance of SomeObj and then uses it in the addEventListener for a click event. So, every time the body gets a click, another EventListener for the click event is added to the body. The problem is that the listeners are never cleaned up, creating a memory leak.
You can also see the EventListeners on the Elements tab.
- Select the Elements tab.
- Select the body tag and then select Event Listeners.

- Expand the click event.

Here are all the listeners (on the body) that were added by all the clicks. This is a classic memory leak. It can cause the browser to slow down and crash.

Be careful adding event listeners. Cleaning up listeners properly is part of building good Lightning web components. Check the Resources section for more information about events and listeners.
Now you know how to use some of the developer tools available in web browsers. Use them to investigate network and memory issues when you're troubleshooting Lightning web components.