Track Emissions with Agentforce Net Zero
Learning Objectives
After completing this unit, you’ll be able to:
- Describe the key differentiators of Agentforce Net Zero.
- Outline the various sources of greenhouse gas emissions categorized by scope.
- List the high-level carbon accounting steps in Agentforce Net Zero.
- Explain how Agentforce Net Zero helps track waste-based emissions.
Meet Agentforce Net Zero
Northern Trail Outfitters (NTO) has been using several Salesforce products for its CRM solutions. Sam Rajan and other executives at NTO are confident placing a priority on deploying Agentforce Net Zero will help them realize their sustainability goals. NTO can use Agentforce Net Zero to effectively and quickly track, analyze, and report on its environmental footprint with reliable, investor-grade data. This data is essential for third-party audits, financial filings, corporate reputation, and building trust with all stakeholders.
Agentforce Net Zero offers the following key differentiators.
-
Breaks down data silos and provides companies with auditable, trusted data because the Salesforce platform offers a single source of truth.
-
Enables users to record data from various sources, such as business travel, electricity, third-party freight hauling, and direct fuel use. It then tracks the energy consumption and calculates the emissions for each of these sources using relevant emissions factors.
-
Comes with ready-to-use emissions factors datasets. Examples include datasets from the US Environmental Protection Agency (EPA), UK Department for Business, Energy & Industrial Strategy (BEIS), and the Intergovernmental Panel on Climate Change (IPCC).
-
Helps companies incorporate procurement data for estimating their value chain emissions and converts spending data into emissions estimates.
-
Helps companies create climate action commitments and set science-based targets that align with their sustainability goals.
-
Helps companies forecast emissions by activity type for upcoming periods and allows users to track targets against forecast data.
-
Tracks supplier sustainability commitments and emissions using scorecards to reduce emissions in the supply chain.
-
Helps evaluate corporate environmental impact with rich data visualizations and prebuilt CRM Analytics dashboards.
-
Helps companies incorporate waste management data for estimating emissions from waste generated during operations and from product end-of-life disposal.
-
Serves as a one-stop solution for companies to easily manage all their carbon credit information, be it projects or actual credits.
A clear net zero strategy begins with solid and consistent data tracking. This makes it possible to set clear, bold targets, track progress over time, and report on progress.
Sam is happy to have found the right tool in Agentforce Net Zero to accelerate NTO’s sustainability journey. Viewing Annual Emissions Inventory for NTO’s Scope 1, 2, and 3 data just got a whole lot easier. Pulling data from multiple spreadsheets is about to go the way of the dodo bird at NTO!
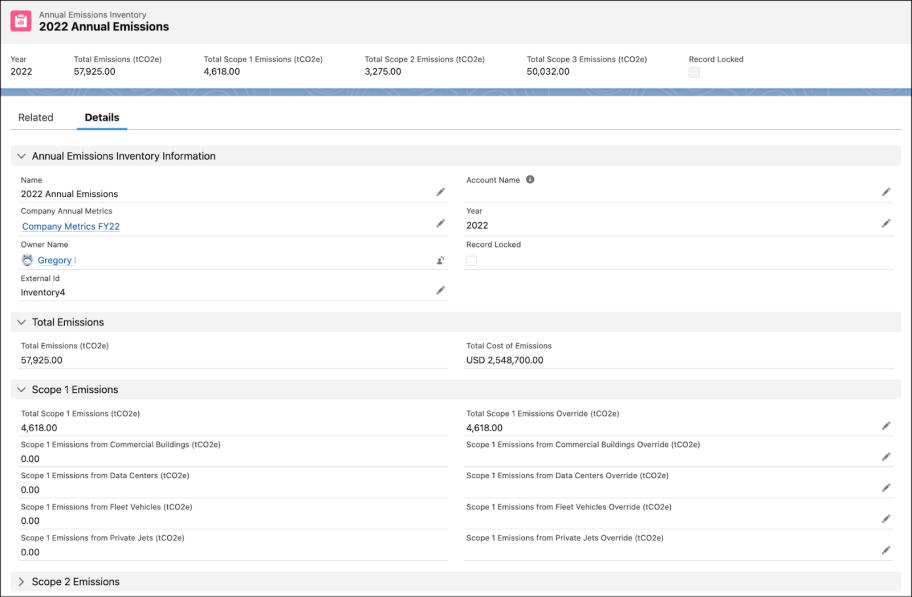
The Annual Emissions Inventory breaks down Scope 1, Scope 2, and Scope 3 emissions, and totals them up. Sam prepares a diagram to help his team understand each emissions level.
Differentiate Between Scope 1, 2, and 3 Emissions
The Greenhouse Gas Protocol has established an emissions inventory that categorizes greenhouse gas (GHG) emissions to outline direct and indirect emissions sources. Calculating its carbon footprint will give NTO valuable information about its sources of emissions and help pinpoint its biggest opportunities for reduction.
To do this, NTO must complete a robust carbon footprint analysis, including calculating emissions from its entire value chain. An accurate emissions inventory paves the way for effective climate targets, short-term reduction strategies, and long-term plans for purchase of the right number of carbon credits to reach net zero.
Quantify Emissions with Carbon Accounting
Similar to the key tasks an accountant looks after to ensure financial health, Sam supervises carbon accounting tasks so NTO can quantify emissions along their journey to net zero.
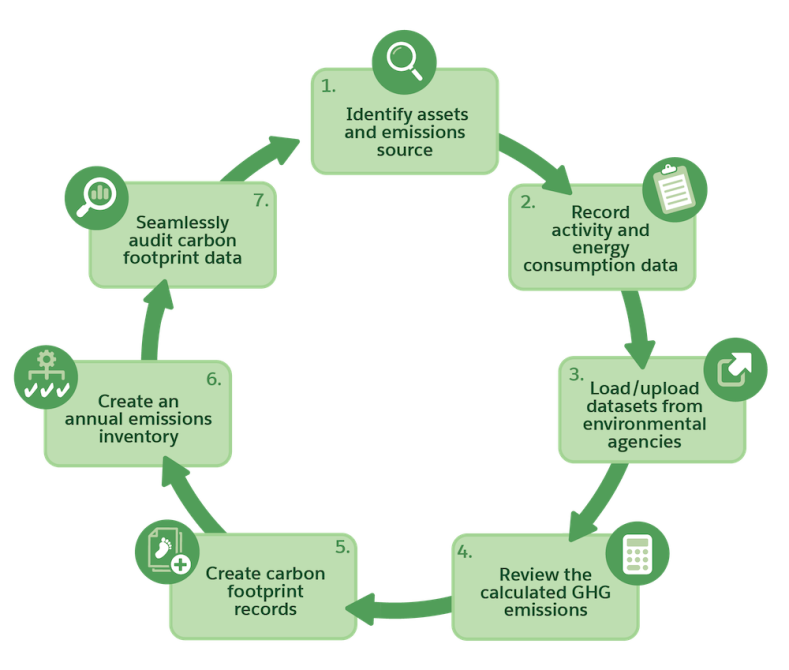
-
Identify assets and emissions sources, such as buildings, warehouses, company vehicles, private jets, data centers, and various Scope 3 activities.
-
Record activity and energy consumption data, such as utility bills, fueling receipts, travel records, and data from suppliers. Also, specify or calculate other critical details, such as renewable energy allocation percentages and fugitive refrigerant emissions. Thankfully, Agentforce Net Zero has built-in calculations so Sam won’t have to perform them manually.
-
Load datasets from environmental agencies in the US, UK, and other standard environmental bodies to convert energy data into reportable carbon numbers. Several emissions factors in the form of reference datasets from standard government or private sources are preconfigured in Agentforce Net Zero. Because the data can be specific to a utility supplier or region, Sam has the option to load NTO’s own reference data too.
-
Review the calculated GHG emissions, which are broken into appropriate scopes for each emissions source.
-
Create carbon footprint records for each emissions source type to roll up and aggregate emissions data by asset for a specific year.
-
Create an annual emissions inventory to sum up emissions from all sources for a year. Agentforce Net Zero aggregates emissions across a company’s assets and procurement activities.
-
Seamlessly audit carbon footprint data to validate the auto-calculated emissions. Sam plans to give his external auditors access to Agentforce Net Zero so that they can perform their assurance work in the same source of truth where all of NTO’s emissions data resides.
This is not really a “one-and-done” scenario, but more of a process that typically repeats each year. So Sam connects the last step back to the first step in the diagram.
Track Scope 3 Emissions with Procurement Hub
The CDP 2020 Global Supply Chain Report states that supply chain emissions are, on average, 11.4 times higher than operational emissions, which equates to approximately 92% of a company's total GHG emissions. Sam is aware of this and knows that Agentforce Net Zero can help him organize supplier data and quantify emissions from value-chain activities.
Sam can use Agentforce Net Zero’s Scope 3 Procurement Hub to categorize and account for the procurement-related Scope 3 emissions. Thankfully, the Scope 3 Hub comes with a Setup Assistant that helps with, well, Scope 3 setup!
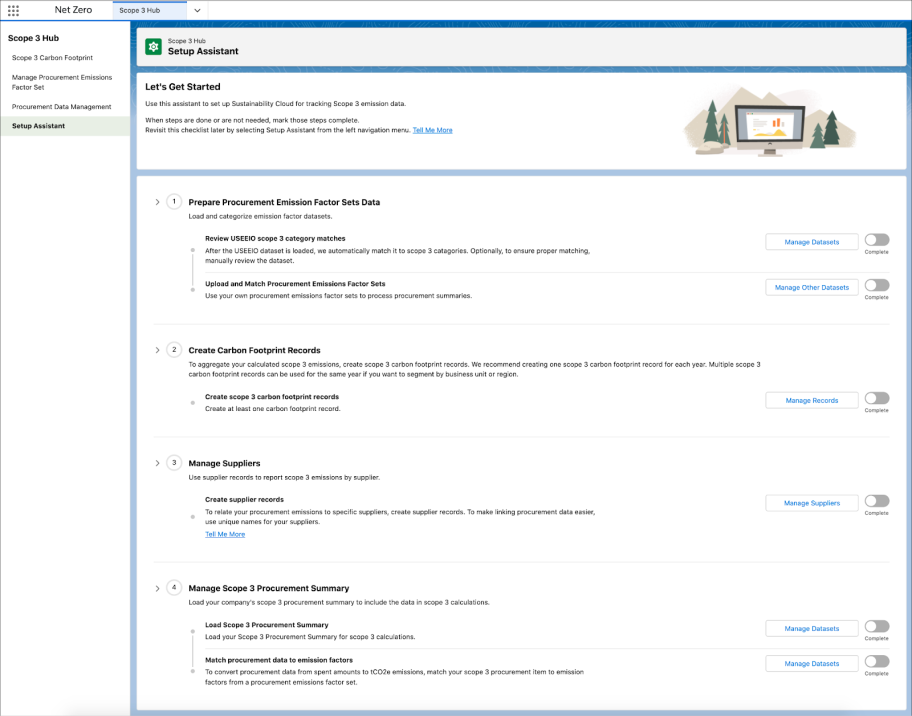
Procurement data containing the company’s spending amounts by category is obtained from suppliers or financial systems. Sam creates procurement carbon footprints to account for Scope 3 emissions. Then, he uses procurement datasets that quantify, classify, and associate spending to the carbon footprint record. With all this data, Sam can easily calculate all procurement-related emissions. If he adds information about its suppliers, Agentforce Net Zero can also aggregate supplier emissions data.
Learn About Tracking Waste
Apart from the energy use and activity data, Sam can also use Agentforce Net Zero to account for the waste generated from NTO’s Scope 1 and Scope 2 activities. But hey, why stop there? Waste-specific emissions factors are applied to the generated waste values to calculate Scope 3 upstream and Scope 3 downstream emissions as well, measured in tonnes of carbon dioxide equivalent (tCO₂e).
Agentforce Net Zero helps Sam keep track of waste generated from operations and waste generated from end-of-life treatment of sold products. The primary data used for waste calculations are waste type, disposal site type, disposed waste quantity, and waste disposal emissions factors.
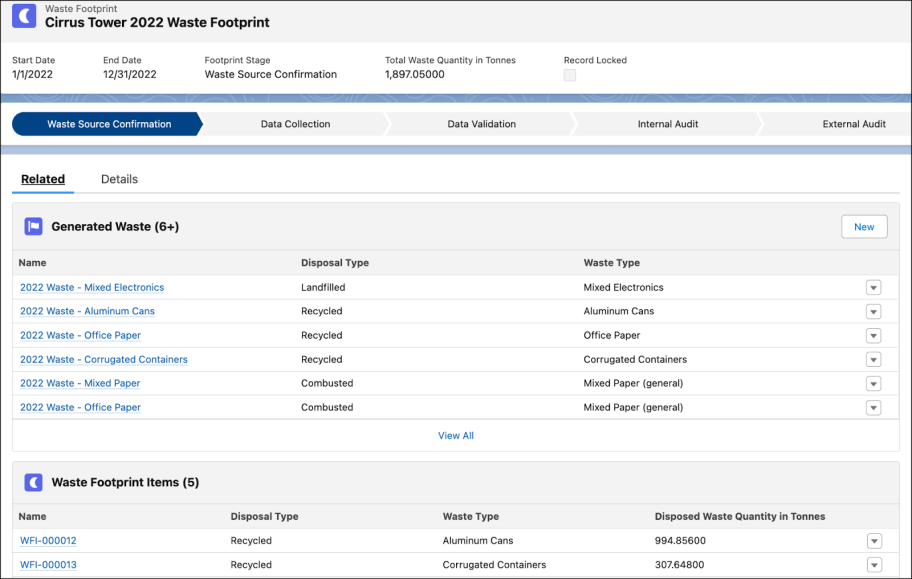
Similar to a carbon footprint record, Sam can create a waste footprint record to aggregate the amount of waste for a specific year or any other reporting period.
Perhaps it’s not bookmark worthy in his browser, but there are many related and detailed views of Scope 1, Scope 2, and Scope 3 carbon footprints and other waste footprints Sam views often. For example, Sam pulls up a detailed view of any one of NTO’s office buildings, then flips over to the related view to see more specific data on the types of waste such as electronics, paper, cans, and so on.
Continue to the next unit to find out how Agentforce Net Zero helps Sam forecast carbon emissions, set targets to reduce emissions, and more!
Resources
- Salesforce Help: Greenhouse Gas Emissions
- Salesforce Help: Consumption Records
- Salesforce Help: Emissions Factors
- Trailhead: Track Emissions for Stationary Assets
- External Site: Scope 3 Calculation Guidance