Explore Additional Features of Agentforce Net Zero
Learning Objectives
After completing this unit, you’ll be able to:
- Discuss how Agentforce Net Zero helps a company manage science-based targets and carbon emissions forecasts.
- Explain how Agentforce Net Zero helps a company track suppliers’ sustainability performance.
- Outline how a company can use Agentforce Net Zero to manage carbon credits and allocate them to carbon offset projects.
- List the out-of-the-box CRM Analytics dashboards available with Agentforce Net Zero.
Set Targets and Make Forecasts
Now that Sam Rajan, chief sustainability officer at Northern Trail Outfitters (NTO), has figured out the carbon accounting process in Agentforce Net Zero, it’s time to explore the other solution capabilities.
First, he investigates science-based targets. These targets provide companies with a clearly defined path to reduce emissions in line with a 1.5-degree Celsius trajectory, which is what science tells us is needed to avoid the worst impacts of climate change. To set a science-based target, Sam must submit a commitment letter to the Science Based Targets initiative (SBTi) establishing NTO’s intent to create a target, and then develop a specific emissions reduction target plan in line with SBTi’s criteria.
Sam can use the Science-Based Targets feature to create and manage this commitment of 1.5-degrees Celsius temperature pathway, or he can commit to a company-level net zero pathway. For the company-level path, he sets the multiple emissions reduction targets required to achieve the commitment by calculating NTO’s base year greenhouse gas (GHG) inventory and then developing its yearly targets using that baseline as a reference point.
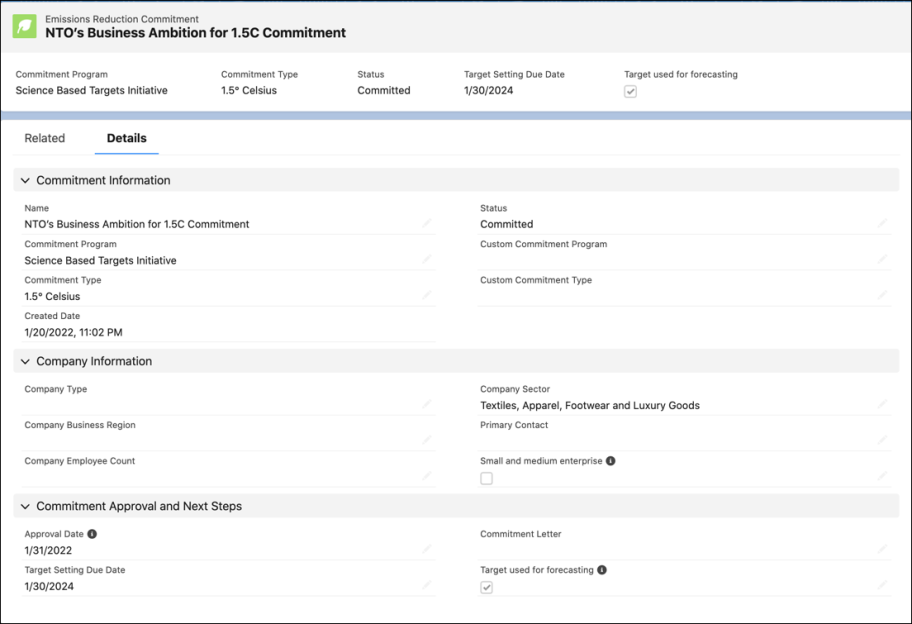
In this example, Sam creates a target to cut NTO’s Scope 1, Scope 2, and Scope 3 emissions by 50% in the next 10 years from the base year of 2020. Additionally, NTO aims to use 100% renewable energy in its operations. All this will help NTO cut its emissions in half by 2030 and achieve net zero emissions by 2050.
Next, Sam explores how Agentforce Net Zero helps NTO plan for the future by focusing not just on current emissions but also on how they will trend over the next 10 to 15 years. He’s thrilled that he can generate effective and accurate emissions forecasts that help him take actions now to meet long-term targets.
Sam generates GHG emissions forecasts at the overall company level and for specific business activities, such as business travel or purchased electricity across all stationary assets. He uses business activity types to calculate the carbon inventory and then sets targets for each activity type, forecasts carbon emissions, and manages carbon offsets.
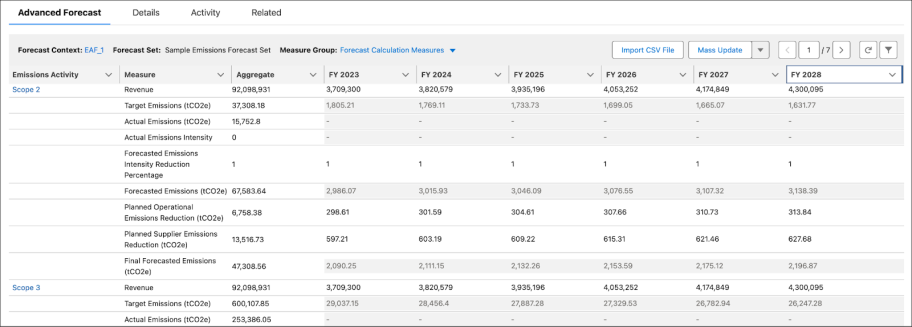
The best news is that Agentforce Net Zero comes with a default forecast set with predefined forecast measures, dimensions, formulas, and inputs. The calculation logic can be customized according to business requirements. Agentforce Net Zero also supports the import of forecast data from a CSV file. The CSV import feature is a time saver for Sam as he uses existing data that helps NTO move further down the pathway to net zero using science-based targets.
Engage with Suppliers
Understanding Scope 3 emissions can help NTO plan for potential regulations and can also guide corporate procurement decisions and product design. To build a more accurate Scope 3 carbon footprint, NTO needs to track emissions from its suppliers. To do this, Sam first calculates NTO’s Scope 3 emissions from procurement entries using the Scope 3 Hub. This gives him a stack rank of the suppliers that have the biggest impact.
He uses the extra horsepower of Salesforce’s External Engagement Management add-on to collaborate with suppliers and collect GHG emissions data from them. Using supplier scorecards in the supplier data model, Sam can track the supplier’s sustainability metrics and commitments at scale. This includes supplier reporting maturity, reported carbon data, and the suppliers’ own science-based targets.
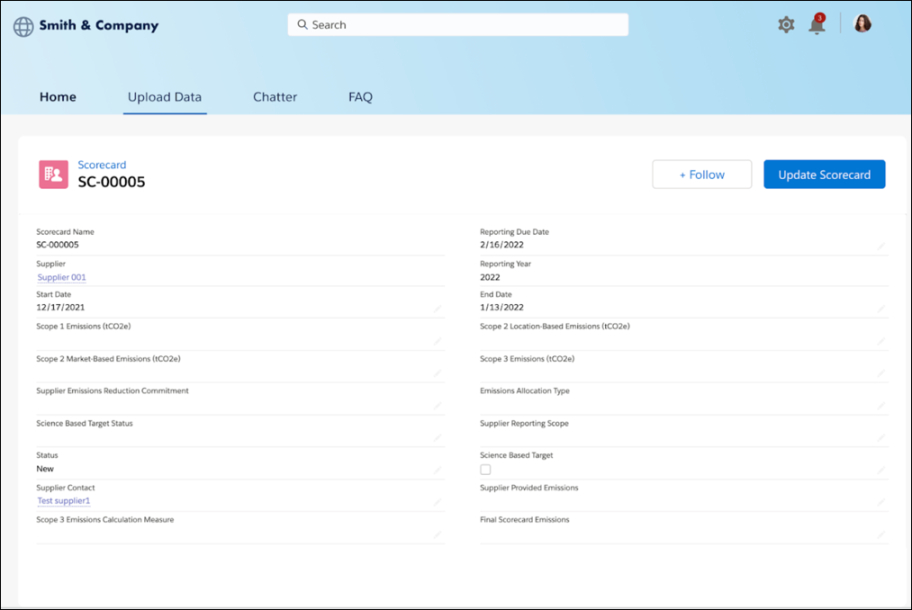
This information helps Sam evaluate how much of NTO’s total carbon footprint is the result of emissions from within its supply chain. Sam now has the necessary data to work with specific suppliers to reduce emissions, make better purchasing decisions, and manage renewable energy and carbon credits to bring NTO to net zero.
Manage and Allocate Carbon Credits
Sam has led several strategic measures to reduce NTO’s carbon emissions. NTO is doing everything it can to reduce emissions. But because some emissions are unavoidable in the short-term, Sam plans to compensate for those emissions with carbon credits. He scours the internet to learn more about carbon projects and where to purchase carbon credits for NTO.
With Agentforce Net Zero, Sam can easily manage NTO’s carbon credits. Using the built-in workflow, Sam can manage and track the carbon credits and their distribution, and visualize the impact of the allocated carbon credits on net emissions.
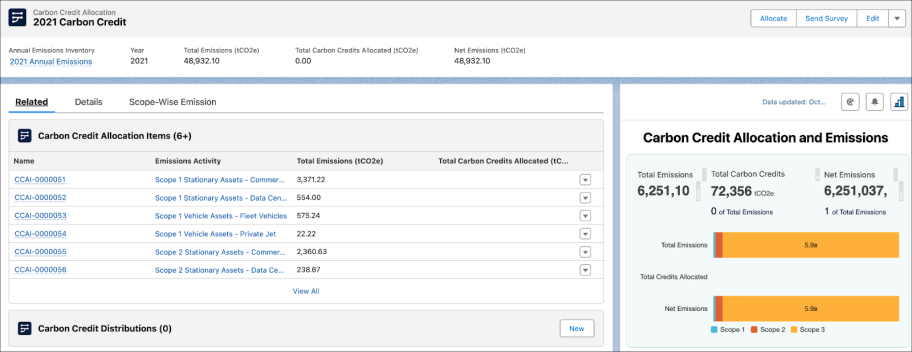
Sam gains approval to purchase carbon credit for NTO at the start of next quarter. He’s looking forward to seeing the Total Emissions bar chart shrink as he allocates the credits!
Gain Insights with CRM Analytics
Agentforce Net Zero comes integrated with CRM Analytics that provides several prebuilt dashboards that summarize energy usage and carbon emissions. Executives can use these point-and-click dashboards to quickly visualize data, and gain critical insights into emissions and overall environmental impact metrics.

The table describes several standard dashboards.
|
Dashboard
|
Description
|
|---|---|
Audit |
This dashboard provides comparison charts about the company’s resource consumption, emissions, emissions factors, and renewable energy use. It shows annual summaries of data from two years, the reporting year, and the comparison year, for context. This dashboard helps with year-over-year comparisons and review of sustainability data. And it can help external auditors with visualizations of records. Dashboard filters include business regions, assets, and asset types. |
Building Energy Intensity |
This dashboard enables comparisons of your office building’s energy consumption and carbon emissions. |
Business Travel Impact |
This dashboard provides data about business travel across the company. Business travel includes air travel, ground travel, hotel stays, and rental cars. Dashboard filters include business region, vendor, and report date. |
Climate Action |
This dashboard provides data about the company’s overall carbon footprint. It helps stakeholders visualize the carbon emission patterns across the company. The total carbon footprint is broken down by categories, such as asset type, report date, and region. The pages detail energy use, carbon intensity, and renewable energy. |
Carbon Credit Allocation |
This dashboard enables you to gain insights into the progress of carbon credit allocation year-on-year, the distribution of the allocation across projects, and the associated cost trend. |
Predicted Air Travel Emissions |
This dashboard provides insights into future air travel-related emissions and recommendations on how to reduce them. For example, switching from air to rail travel would reduce emissions by a certain percentage. |
Predicted Carbon Emissions and Fuel Consumption by Stationary Assets |
This dashboard allows you to view the predicted carbon emissions and fuel consumption by stationary assets in a particular future year and the percentage increase in carbon emissions from the previous year. Optionally, you may filter the prediction data by business region, fuel type, and stationary asset type. |
Scope 3 |
This dashboard displays information on Scope 3 emissions calculations, broken down by Scope 3 category and supplier. |
Supplier |
This dashboard allows you to gain insights into the suppliers’ emissions and their sustainability efforts. You can use these data-driven insights to suggest measures for emissions reduction and improve the suppliers’ sustainability scores. |
Waste Management |
This dashboard provides data about the company’s waste disposal and waste footprint. |
Water Management |
This dashboard provides water consumption, withdrawal, discharge over the years and the distribution of water KPIs such as water risk, water stress, across different geographies and stationary assets, so you can take effective measures to manage water. |
ESG |
This dashboard helps you plan and track carbon reduction projects and other environment, social, and governance (ESG) impact improvement projects across your portfolio. |
Each of the dashboards contains a wealth of information. Some reveal high-level trends that are easy to see at a glance, while others show deeper insights as you scroll, hover, and click your way through the sample data analytics.
Onward and Upward
As you can see, NTO is well along on its journey to reach net zero faster. Companies can join NTO in using Agentforce Net Zero to quickly measure their environmental impact, report findings to key stakeholders such as executives and auditors, and track environmental impact year over year.
Resources