Build a Semantic Layer
Learning Objectives
After completing this unit, you’ll be able to:
- Navigate the Tableau data pane.
- Explain how field types are arranged in Tableau.
- List data types.
- Explain how redundant fields are treated in Tableau.

Before You Start
Before you start this module, make sure you complete The Tableau Data Model. The work you do here builds on the concepts and work you do in that module. You get familiar with the data you work with in this module, as well as some of the basics of the Tableau experience.
Get Your Data Ready
Some people can create gorgeous meals and baked goods out of thin air and chaos. For others, there’s mise en place. This concept comes from French cuisine and means “everything in its place.” It’s so much easier to bake a pie when the butter is already cubed and cold, or to decorate a beautiful cake when the offset spatula is ready and where it needs to be when you reach for it.
For data and analysis, it’s the same thing. There’s some cleanup you can do to make the data even easier to work with. This is referred to as metadata management, or developing the semantic layer of your data (though a semantic layer goes much deeper than what is covered here).
With Tableau, we're all about the cycle of visual analysis—and that means metadata management can happen in the flow of analysis. You learn how below.
Navigate the Tableau Workspace
The authoring environment for Tableau is built for both analysis and interacting with the data directly, managing things like:
- Data type
- Default aggregations
- Calculations
- Split or combined fields
- Grouping and hierarchies
Here's a preview of the workspace and how all this comes together when you work with your data.
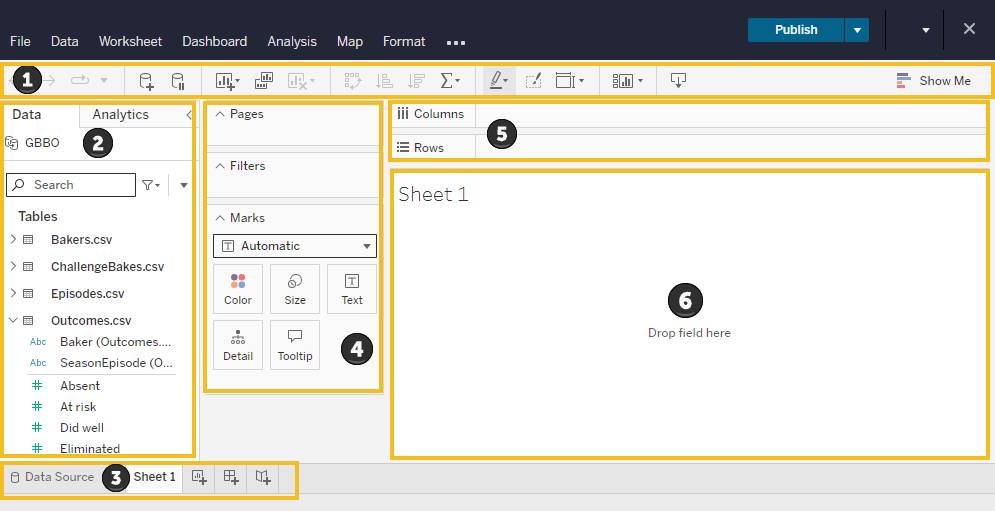
- The toolbar where you can go back steps, add data sources, clear sheets, control image fitting, and more.
- The Data pane, displaying tables of data and their fields. Drag fields out from the Data pane to build a viz.
- The sheet tabs, including the Data Source tab. These are similar to sheet tabs in Excel or Google Sheets and allow you to flip between different vizzes.
- The Marks card, and above it the Filters shelf and Pages shelf. The Marks card controls much of the appearance of marks in the viz.
- The Marks card has properties like Color, Size, Text, Detail, and Tooltip. These properties are sometimes called shelves. The important thing is that they're drop areas where you can put fields and change the structure of the viz. What properties show on the marks card can change based on the mark type.
- The Marks card has properties like Color, Size, Text, Detail, and Tooltip. These properties are sometimes called shelves. The important thing is that they're drop areas where you can put fields and change the structure of the viz. What properties show on the marks card can change based on the mark type.
- The Columns and Rows shelves. These control the main structure of the viz.
- The viz canvas, where the magic happens! You can also drag and drop fields directly here from the Data pane rather than putting them on a shelf.
Before you get hands-on with Tableau in this module, it’s important to review these in detail.
Get to Know the Data Pane
The Data pane shows which data source you're using, a search bar to find fields, and the list of tables and their fields.
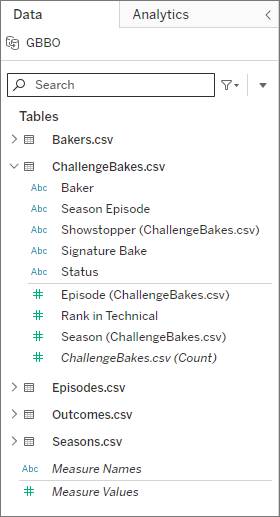
Fields are arranged in alphabetical order but divided by a horizontal line: Above the line are dimensions, and below the line are measures. Additionally, fields are color-coded as blue or green to indicate if a field is discrete (blue) or continuous (green).
Dimensions are usually fields of categorical data (like brands or colors) and measures are usually fields of numerical data (like length or price) that you can do math with. To change a field from a dimension to measure or vice versa, simply drag the field above or below the line in its table. This is helpful when something like a numeric ID field is mistakenly assigned as a measure.
There are also data type icons in front of each field, such as a calendar for a date, Abc for a string (text) field, and a number sign for a numeric field. If the data source, such as a database, doesn’t define the data type, Tableau can usually identify the correct data type.
To change a field’s data type, click the icon in front of it and choose the correct data type. This is often done to ensure the field can be used in the right kinds of calculations or displays properly, such as a date field having a drill-down from month to week to day.
Beware of Redundant Fields
If your data set has more than one table, chances are you’ll wind up with multiple fields with the same name. In Tableau, every field name must be unique. So if you see a field has (Table name) at the end of it, that means there’s a field with that name somewhere else in your data set.
These tend to be fields that are used in the relationship clauses to define how tables relate to each other. We can't delete these fields. And analytically, we only need one version of each field—the version of the field that's most complete.
For example, in the data set you use in this module, SeasonEpisode is in both the Outcomes and ChallengeBakes tables.
- The Outcomes table tracks the status of each baker at the end of an episode. It doesn't have any records for the season finale because the finale has a different format.
- The ChallengeBakes table has the definitive list of all episodes for all seasons.
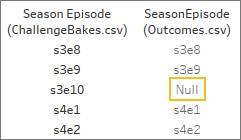
If you keep the Outcomes table’s version of the SeasonEpisode field, you’d lose the finale episode. Instead, keep the SeasonEpisode field from the ChallengeBakes table and hide any copy of SeasonEpisode outside the ChallengeBakes table.
It’s important to remember that just because fields have the same name doesn’t mean they're redundant. Multiple tables can have fields with the same name that contain entirely different information. Imagine if the data set had a table for Hosts and a table for Judges. You can’t simply hide the Name field in one of those tables without losing information.
Always know your data and validate your assumptions! You’ll get hands-on and follow these best practices in the following units.
Put Your New Metadata Knowledge Into Action
There’s a lot more that can be done in the Data pane for metadata management, including creating hierarchies, combining or splitting fields, and creating calculations. But we’ve stuck with what’s relevant for this module.
Now it's time to mise en place your workspace to set yourself up for analytical success!