View the Pacing Status of Active IOs
Learning Objectives
After completing this unit, you’ll be able to:
- Describe what the Pacing app can do.
- Explain how to use the Pacing app.
Now that Isabelle has set up the MTC, she’s ready to install the Pacing app from the Marketplace. The Pacing app immediately visualizes all the IOs that are currently active, along with their pacing status, for Isabelle and her team. The Pacing app uses data from Isabelle’s existing MTC setup and is therefore reliant upon it in order to function. Although you can produce the same insights within the MTC setup itself, the Pacing app provides these insights out of the box with zero effort.
The app shows each individual IO along a timeline, with its own start and end date. And it uses color coding to illustrate pacing status.

- Green: On track
- Yellow: Pacing risk
- Red: Underpacing
- Purple: Overpacing
Color coding and filtering allow Isabelle and team to quickly identify the IOs that need immediate attention. Isabelle can filter the display for specific campaigns or by the number of activity days remaining. Isabelle wishes to address the urgent cases first, so she filters the list to show IOs that are over-or under-delivering with only 4 days of activity left. Her rationale is to quickly attend to IOs with problems before their time is up.
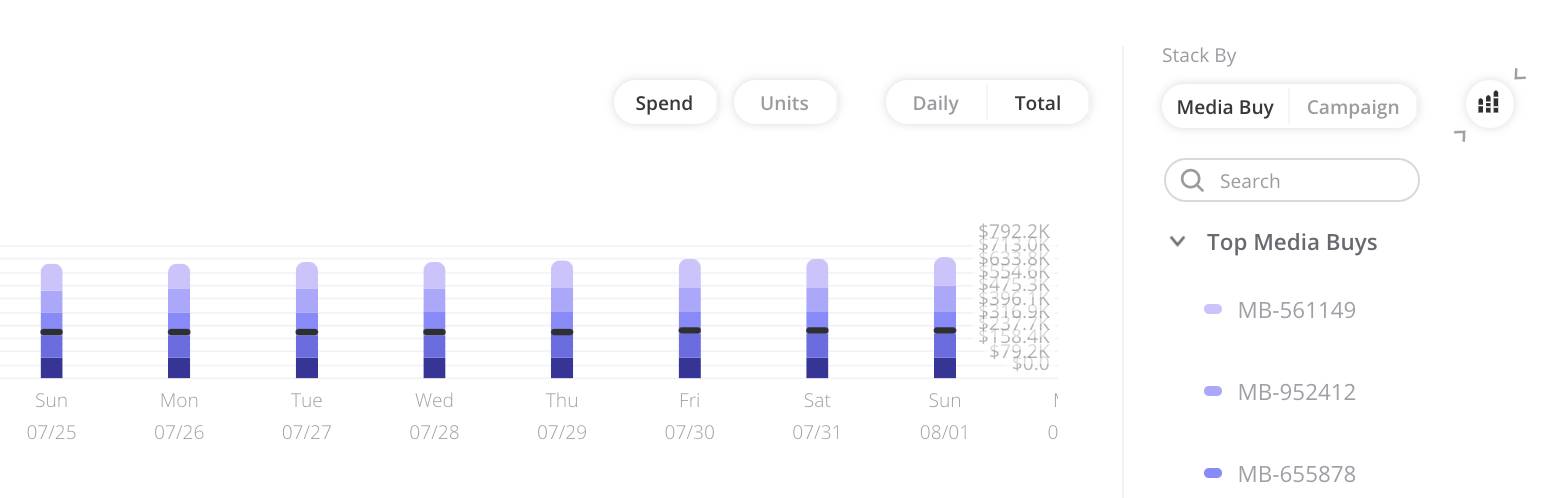
When she clicks on a particular IO from the main display, she sees a detailed view of the IO in question, including the cost it has actually accumulated to date compared with the cost it was expected to accumulate to date.

This drill-down allows Isabelle to investigate the cause of the over-delivery. She notices that on each passing day, the actual accumulated cost exceeded what was expected. In order to find out if this was the result of a single day’s over expenditure, or an ongoing excess on each day of activity, she changes the view yet again by clicking the Daily breakdown option. This shows her what actually transpired on each day.

She identifies that this was an everyday occurrence, and begins to suspect that somebody forgot to configure a maximum budget for this activity on one or more of the ad platforms. She adds the associated media buys onto the display to find out which media buys were involved so that she can take further action.
Now that she knows which media buys were involved, she instructs her team to configure a budget for these in order to curtail any further unintentional overspending.
It is important to note that although the MPC and MTC both contribute to the media planning process, they are completely independent of each other technically. They each can be implemented and used alone.
Media planning is a complex discipline. With Marketing Cloud Intelligence’s sophisticated and powerful media planning tools, even novice users can start to make data-driven media planning decisions that can increase ROI.
Now it’s your turn to apply what you’ve learned about these three Marketing Cloud Intelligence tools, start contributing to your company’s media planning efforts, and make your mark with this very sought-after skill!