Explore the Media Planning Center
Learning Objectives
After completing this unit, you’ll be able to:
- Use the MPC to generate powerful insights about your budget allocation plan.
- Describe how the different MPC features and tools function.
The Plan Grid
Now that her configuration process is complete, Isabelle opens the app and takes a look around.
The opening screen of the MPC shows an outline, or grid, of her budgeting plan. This grid contains all of the dimensions in the hierarchy she defined, according to the set timeframe. She can start entering her budget figures at the lowest levels of the plan. She can also use the Split functionality to assign budget figures at higher levels and define how these trickle down to the levels below. Furthermore, she can add budget figures in bulk and fill up her entire plan in an instant by importing existing cost measurements from her workspace using the Import option.

Forecasting Performance
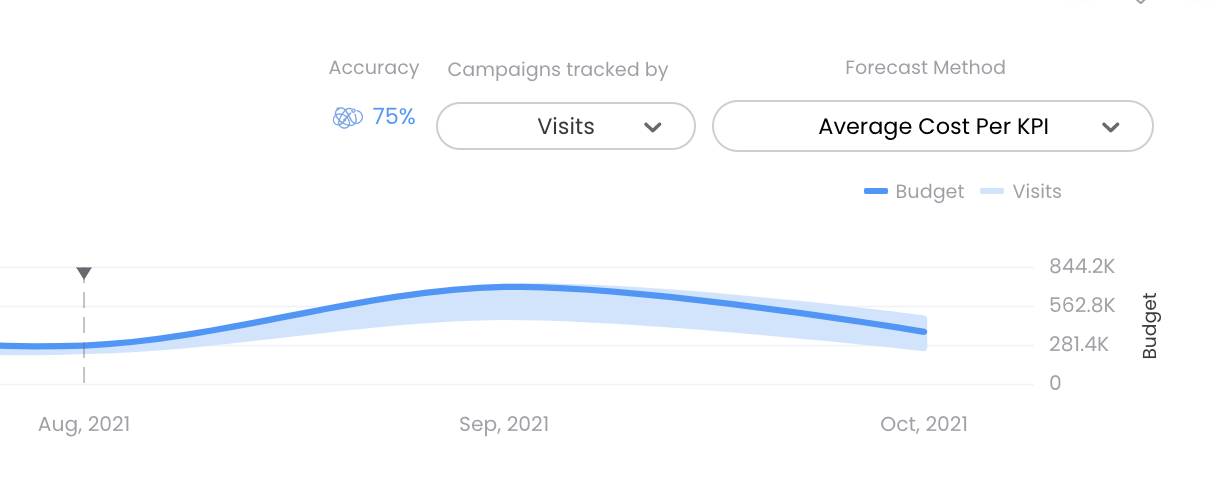
The Forecast section displays the effect that the budget had on past performance and also predicts future performance. The MPC makes this prediction based on a computation of past performance data and the future planned budget. Isabelle can use the dropdown to choose from a selection of forecasting methods.
The MPC displays the forecast as a range of numbers, known as the confidence interval. The confidence interval spreads across two standard deviations from the mean, for all methods. In general, the more delivery data NTO accumulates, the more accurate the predictions.
To view forecasting for a particular entity, Isabelle simply highlights the entity and the forecasting feature shows up at the bottom of the display.
Forecasting can help Isabelle fine-tune budgeting decisions with specific targets. If, for example, forecasting predicts that a budgeted entity is likely to fall short in the number of total conversions she must achieve during the period, she can reallocate budgets to fix the problem. She can quickly implement a wiser budget spread by moving some budget from an entity that’s forecasted to far exceed required targets to entities that are falling short.
Budgeting Optimization
The Optimize section calculates and compares the cost per unit for each of the entities, and recommends how to budget this time around based on past performance. The MPC derives cost per unit from the KPI you assign. If your KPI is Total Conversions, for example, it compares the cost per single conversion among the entities selected.
Let’s consider some scenarios. If an entity was cost-effective in the past but is budgeted relatively low compared to others in the current plan, the MPC will suggest an increase in this budget allocation. If an entity was expensive in the past and is budgeted relatively high in the current plan, the MPC will suggest a decrease in this budget allocation.
The Optimize section uses a scatter plot quadrant graph to display its findings and make recommendations.

Isabelle can use this display to reallocate budget from the diagram’s danger zones into its sweet spots. She can quickly see which entities are over-budgeted and which are under-budgeted and act accordingly. Isabelle is impressed. Using the tools she can start making data-driven budgeting decisions that are likely to increase ROI for NTO.
For a more detailed guide on how to use the MPC, check out the MPC Tutorial video.
Scenario Planning
And there’s even more at her fingertips. The MPC’s Scenario Planning allows her to compare multiple versions of a plan by its projected KPIs. This is a huge game changer! It means that Isabelle and her team no longer need to base their budgeting decisions on just one plan. What if they distributed the budget across channels differently—perhaps less search and more social? What if they distributed the budget across platforms differently—perhaps more Tik Tok and less Facebook? They can try all of these scenarios and more, and the system will run its forecasting calculations for each one to help the team immediately identify the scenarios that are likely to produce the best results.
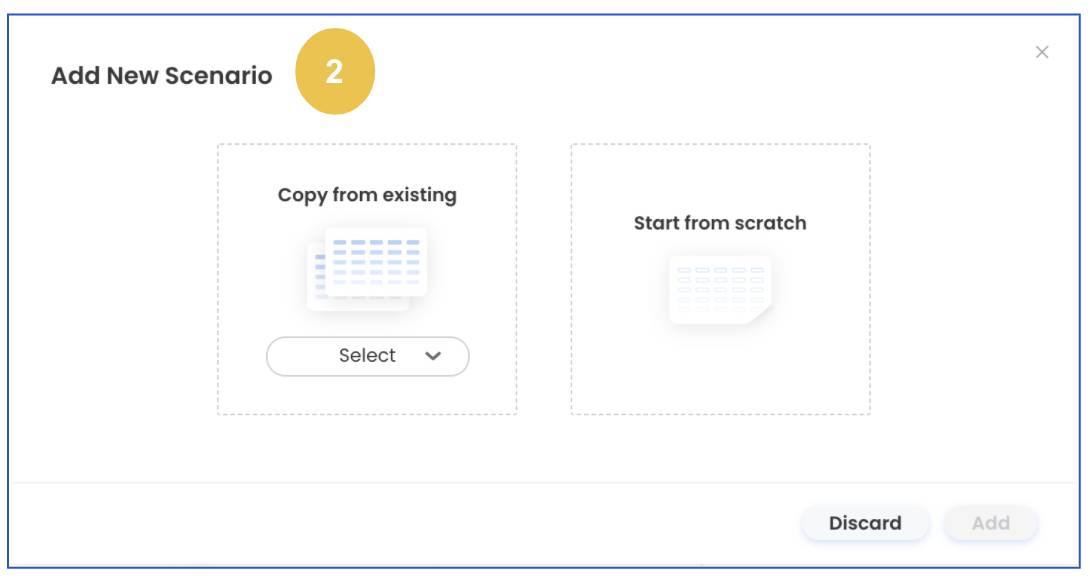
To add a new scenario, Isabelle simply clicks on the plus button (1) and either copies an existing scenario to use as a template, or starts from scratch (2).

Once Isabelle creates all the scenarios she wishes to compare, all she has to do is click Simulate to run the comparison analysis.

The simulation forecasts each plan’s KPI totals for the defined time frame, so Isabelle can identify the one most likely to fulfill NTO’s objectives.

While in simulation mode, Isabelle can also use the forecast method drop-down to change the projected KPI forecasting method. This gives her the flexibility to go with the method that she trusts most.

For more on scenario planning, watch this video.
The MPC is a true game-changer for media planners, and it can raise the bar at the execution stage as well. In the next unit you learn how the Media Transparency Center (or MTC) aligns your media plans with data on their actual execution, allowing you to pace and optimize your campaigns in mid-flight.