Define Account Forecast Settings
Learning Objectives
After completing this unit, you’ll be able to:
- Configure forecast generation and display settings.
- Configure forecast adjustment settings.
- Set up performance guard rails for account forecasts.
Meet Drake, A Star Account Executive
Drake “The Crusher” Elliott manages Rayler Parts’s best-performing sales team, including Vance. After Elliott hears that Vance and Cindy are exploring Manufacturing Cloud, he is keen to find out more. With the next fiscal year around the corner, Elliott wants to find out how his team can use Manufacturing Cloud to plan for the business. He also wants to find out from Cindy whether Manufacturing Cloud can offer him tools to manage the revenue targets better.
Cindy tells Elliott that Manufacturing Cloud includes account forecasting as well as the tools that help managers create and assign sales targets for their team members. Elliott is stoked!
Account-based forecasting surfaces insights across the entire business by breaking down internal silos to allow sales, finance, and operations teams to develop more accurate forecasts. Account teams can then add updates on changing customer needs or broader market demands, which allows the team to adjust plans and estimates in real time.
Keep the Numbers Rolling
The first and most important requirement for Elliott’s team is to find a way to consistently project quantity and revenue numbers for accounts. As a manager, Elliott needs forecasts at an account-level to get an idea of how a particular product is performing across different accounts. Elliott’s team can make data-driven decisions based on forecast numbers.
Cindy sets up account forecasting. First, she opens the Account Forecasting page in Setup.
- Click
 , and select Setup.
- In the Quick Find box, enter Manufacturing.
- Click Account Forecasting.
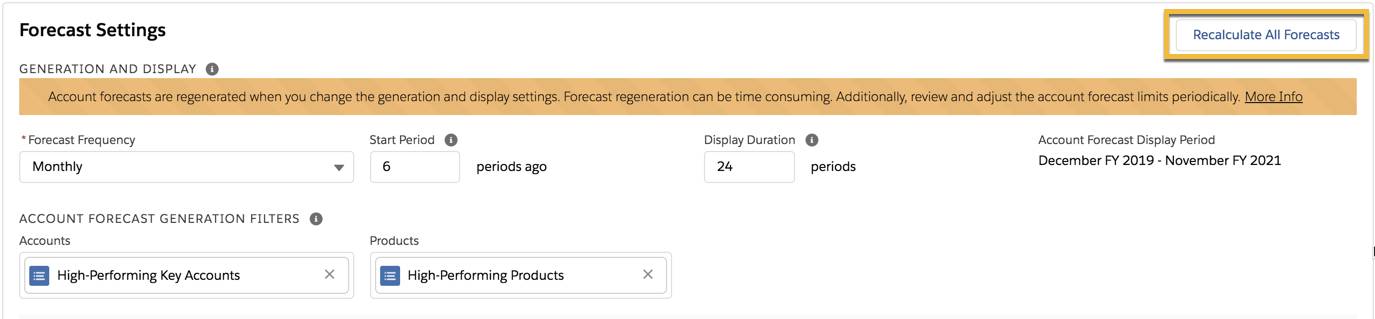
- In the Forecast Settings section, define the following for Generation and Display:
- Forecast Frequency: Select monthly or quarterly. Cindy selects Monthly.
- Start Period: Select the number of periods to go back and generate a forecast for. The current period is June 2020. To get the best comparative forecast, Elliott decides to go back 6 months. Cindy enters the Start Period as 6.
- Display Duration: Select the total number of periods to display forecast for. At any given time, Elliott wants to view the forecast numbers for 24 months. Cindy enters the Display Duration as 24.
The Forecast Display Period is automatically populated based on Cindy’s selections. She can see that the total period of forecasts that are generated and displayed for accounts now is December 2019 to November 2021.

At the end of each month, the forecast display rolls over and adds another period to the display. So with a duration of December 2019 to November 2021, at the end of the current month June 2020, each account will get a forecast from January 2020 to December 2021. The cycle never stops because, with each passing month, another month gets added. It’s like a roller coaster that just keeps going, and going, and going.
Optimize Performance with Data Guard Rails
A high volume of data is a defining attribute of the manufacturing industry, especially for sales and operations. For a large company like Rayler Parts, it has many accounts, and generating forecasts for all accounts all at once can be time-consuming.
Certain actions automatically trigger regeneration or recalculation of forecasts for all accounts in the org.
- When account forecasts are regenerated in bulk due to changes in forecast generation and display settings
- When account forecasts are recalculated in bulk to reflect any changes in forecast formulas
- When account forecasts are recalculated at the start of an adjustment period for new and existing products.

Luckily, Manufacturing Cloud comes with prebuilt guard rails that allow optimal performance. With guard rails, Rayler Parts can focus on accounts and products that require forecasts and it improves the quality of forecasts because you can target a concentrated number of records at a time.
To reduce the number of records affected by the regeneration or recalculation at once, Cindy can restrict the process to the key accounts and products. She can create list views for Accounts and Products and select a combination of the two to recalculate forecasts. For example, Rayler Parts would like to recalculate forecasts for only six of their high-impact accounts and 500 key products. There’s no point in forecasting for secondary products such as nuts and bolts, paint, and other raw materials.
Cindy has created two list views for the high-performing accounts and products that she’d like to generate and recalculate forecasts for. To learn how to create list views, see Work with List Views in Lightning Experience. Now she needs to select the list views as the filters for forecast generation in Setup.
- Click
 , and select Setup.
- In the Quick Find box, enter Manufacturing.
- Click Account Forecasting.
- In the Account Forecast Generation Filters section, select the following:
- Accounts list view: High-Performing Key Accounts
- Products list view: High-Performing Products
Note: Account managers can generate forecasts only if either All users can see this list view or Share list view with groups of users is selected for the list views.
- Click Recalculate All Forecasts to recalculate forecasts for the selected accounts and products combination.
- Click Save to apply the filters and save other changes on the page.
- To generate forecasts for all accounts irrespective of filters, keep the filters empty and click Save.
With Manufacturing Cloud, companies can choose their own data usage limits. The Salesforce executive has granted the data volume limits to Cindy. The two key factors that Cindy has kept in mind while requesting for data limits are scalability and performance for a company like Rayler Parts.
Cindy evaluates the information available in the Account Forecast Limits and Use section on the Account Forecast setup page.
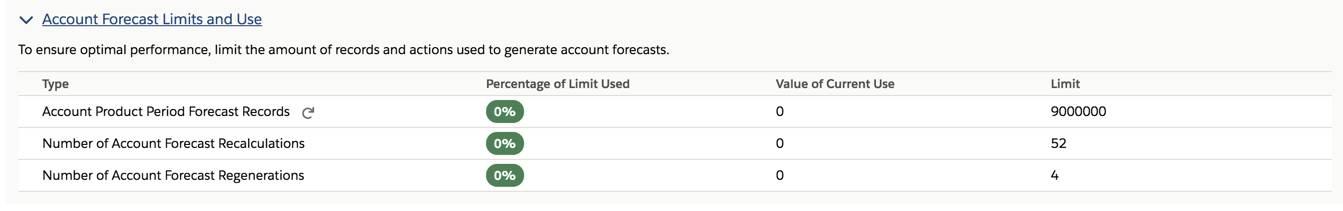
She can view the limit, the value of limit used, and the percentage of the limit used for Account Product Period Forecast records, the number of Account Forecast Recalculations, and the number of Account Forecast Regenerations.
Cindy analyzes what each field means for the performance limits. She interprets the values and prepares a report for the executives.
Type |
Information |
|---|---|
Account Product Period Forecast Records |
The value of current use and percentage of usage are updated whenever bulk regeneration or recalculation of account forecasts take place.* Click Refresh to reflect the latest values in case the limit is changed by the admin. |
Number of Account Forecast Recalculations |
Each time the Recalculate All Forecasts button is clicked and a process is triggered, the numbers change for current use and percentage of limit used. |
Number of Account Forecast Regenerations |
If there are changes to forecast generation and display settings, regeneration of all account forecasts is triggered and the numbers here change. |
The Percentage of Limit Used field values are color-coded. Based on the volume used, the colors change from green to yellow and to red, like a traffic signal. Cindy must keep an eye on the color and make sure Rayler Parts never hits a red signal. Pretty cool, right?

Make Adjustments, Not Compromises
Cindy and Elliott revisit the report that Vance had shared with Cindy earlier (Vance’s key findings from the first unit), and one of the requirements pops out: the ability to track changes to sales figures made by colleagues during the company’s quarterly planning period.
Elliott has an idea: What if at the start of each month, he allocates a week for account managers to collaborate on forecasts? This allows for flexibility in course-correction and helps managers edit forecast numbers based on market changes or production scheduling changes. With the next monthly planning session coming up in a few days, Elliott works with Cindy to implement his idea.
He asks Cindy to set up forecasts such that the first week of each month is reserved for his account managers to edit forecasts. Elliott’s team can adjust forecast numbers based on executive decisions, competitor pricing, and so on. After the first week, the numbers will be locked for the rest of the month.
Cindy can define the adjustment period details for Rayler Parts in Setup. It’s pretty easy actually.
- Click
 , and select Setup.
- In the Quick Find box, enter Manufacturing.
- Click Account Forecasting.
- In the Forecast Settings section, define the following:
-
Adjustment Frequency: Select the frequency at which forecasts can be manually adjusted. Cindy selects Monthly.
-
Adjustment Period in Days: Select the number of days allowed for forecast edits. Cindy enters 7. Remember, Elliott wants to plan for a week.
-
Allow Adjustments: Select whether to allow adjustments at the start or end of each quarter. Cindy selects During start of period.

Account managers can now collaborate and modify forecast values for accounts during the first week of each month.
- Based on the forecast revenues, the account managers know which accounts to target to drive business.
- Based on the forecast quantities, Rayler Parts can plan inventory and stock up for the upcoming month.
Manufacturing Cloud also generates forecasts automatically for new products at the start of each adjustment period. This is especially useful because Rayler Parts is planning to introduce a new product for the upcoming quarter: trenching bucket. If a new product is introduced, at the start of the next adjustment period, a forecast for the new product is calculated.
Cindy has covered a lot of ground with account forecasts but she sees that there’s a lot more that she can do on the Account Forecasting page in Setup. She is eager to find out more about custom metrics, displayed metrics, and forecast formulas.
Resources
- Salesforce Help: Set Up Account Forecasting
- Salesforce Help: View and Maintain Forecasts
- Salesforce Blog: The Next Generation of Manufacturing is Here