Visualize Your Data with the Lightning Dashboard Builder
Learning Objectives
After completing this unit, you'll be able to:
- Explain the difference between report charts and dashboards.
- Create a dashboard and underlying report.

Create Dashboards
Employees at Ursa Major Solar rely on great reports to help them make decisions and take action, like who to call today. But sometimes they need to see the significant picture. Enter the dashboard, unmatched in its ability to summarize and display Salesforce data in a graphical layout.
Salesforce dashboards present multiple reports side-by-side using dashboard widgets on a single dashboard page layout. Dashboard widgets come in various chart types, tables, metrics, and gauges, and you can customize how data is grouped, summarized, and displayed for each widget. The dashboard builder is an intuitive interface for building dashboards from source reports you’ve created in Salesforce.
In addition to dashboards, you also have options to add charts to reports and record page layouts. Read on to learn how to visualize data with report charts and dashboard widgets.
Dashboard Builder
Dashboard builder is your way to visualize your data for easy consumption at-a-glance. Launch the dashboard builder from the Dashboards tab by clicking New Dashboard. Enter a name for your dashboard, and click Create.
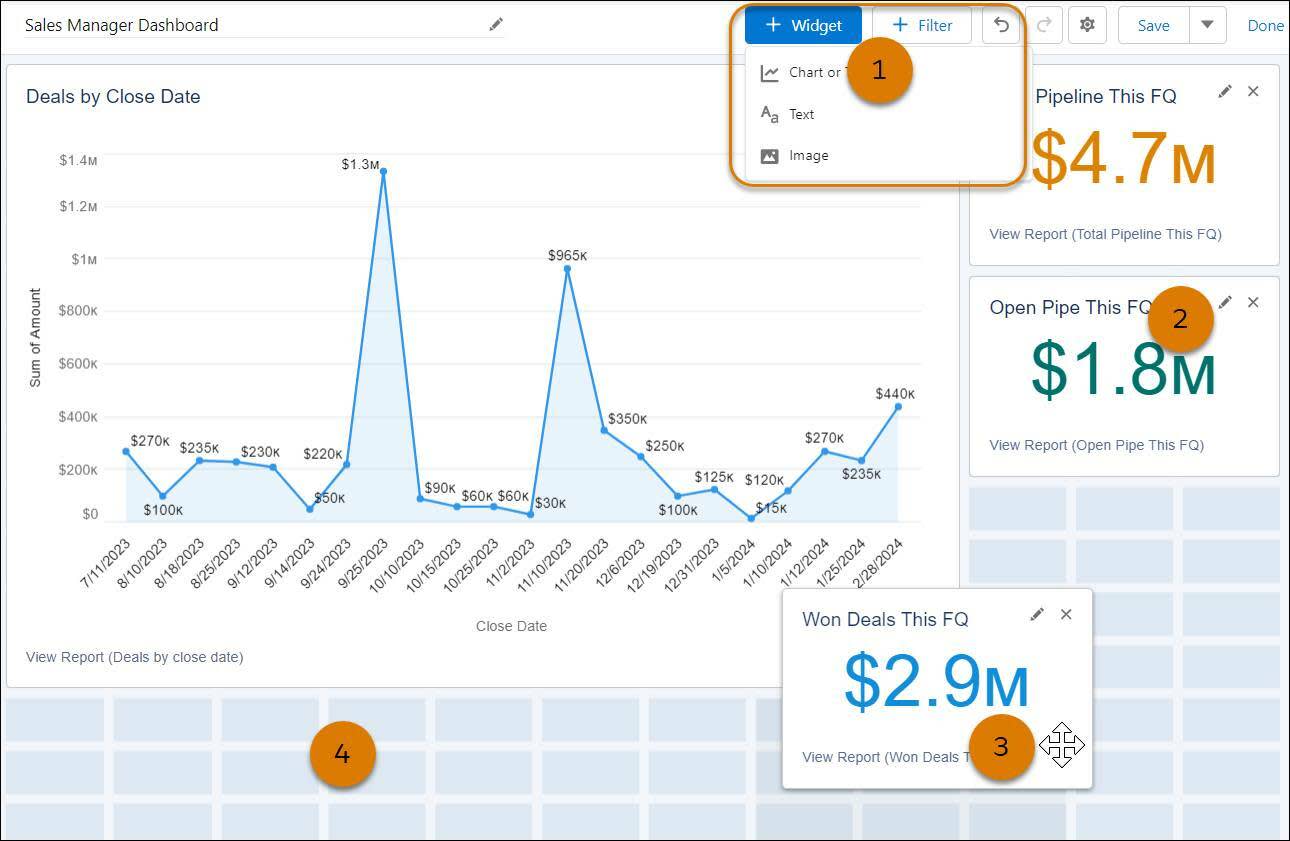
Insert a widget onto your dashboard by clicking + Widget, or add a filter by clicking + Filter [1]. When prompted, select the type of content for your new widget, or a field and criteria for a filter. Each widget shows rich text, an image, or data from one report. After you’ve added a widget, click it to resize it, delete it, or change its data-supplying source report (  ) [2]. Position your widgets by dragging them [3]. A responsive grid layout supports widgets of different sizes in diverse arrangements [4].
When selecting the widget type, consider the following.
Widget Type |
When to Use It |
|---|---|
|
Use a chart when you want to show data graphically. You can choose from various chart types. |
|
Use a gauge when you have a single value that you want to show within a range of custom values. |
|
Use a metric when you have one key value to display. |
|
Use a table to show a set of report data in column form. |


Finally, when selecting a source report for use in a dashboard widget, keep in mind that you can’t choose joined reports or historical trend reports.
Create a Dashboard
Roberto mentioned Maria on Chatter to ask for a comprehensive overview of Ursa Major Solar’s sales pipeline. Let’s help Maria create a dashboard for Roberto. First, you’ll create the source report you use in the dashboard. Let’s make a simple Leads report.
- Click the Reports tab, click New Report and select Leads as the report type. Click Start Report.
- Click Filters and edit these standard filters:
- For the Show Me standard filter, select All Leads. Click Apply.
- For the Date Field standard filter, select Create Date. For Range, select All Time. Click Apply.
- Click Outline and group rows by Lead Source. From the Add group lookup, select Lead Source.
- Ensure that these columns are included in your report: Lead Owner, First Name, Last Name, Title, Company/Account, Rating, Street, Email.
- Click Save, name your report
Leads by Lead Source, and accept the auto-generated unique name. Click Save.
- Click Run. The report should look something like this:

Now that your report is created, let’s visualize it using a dashboard widget.
- From the Dashboards tab, click New Dashboard.
- Name your dashboard
Leads Dashboardand, optionally, enter a description.
- Click Create.
- To insert a widget, click + Widget.
- Choose Chart or Table.
- From Select Report, choose the Leads report you created earlier, Leads by Lead Source, and click Select. From Add Widget select the donut chart.

- Confirm that your widget is titled
Leads by Lead Source.
- Optionally give your widget a subtitle and footer.
- Click Add. Your new widget appears on the dashboard.
- Optionally, resize your dashboard widget by clicking it, then dragging the corners and sides.
- Click Save and then click Done. Your dashboard should look something like this.

Great job! You just built a simple report and dashboard for visualizing leads by source.
Use Dynamic Dashboards
With dynamic dashboards, each user sees the data they have access to without needing to create separate dashboards for each user.
This means a single powerful dashboard can be used for multiple users in your company, because the logged-in user viewing the dashboard sees the data they should see, based on their security and sharing settings.
Let's look at an example over at Ursa Major Solar. Say that the sales team consists of one vice president, four sales managers, and 40 sales reps—ten reps per manager. Maria needs to create dashboards that display the following metrics, restricted by role and hierarchy:
Role |
Total Bookings |
Close Rates by Competitor |
Number of Activities by Meeting Type |
|---|---|---|---|
Sales Rep |
|
|
|
Sales Manager |
|
|
|
VP of Sales |
|
|


Sales reps should only see their own data; managers should only see data for the reps they manage; and the VP should see data across the entire team. In this scenario, Maria typically would have to create 45 different dashboards—one for every single person. She’d also have to create multiple folders to manage access rights.
With dynamic dashboards, Maria can create just two dashboards and store them in a single folder. All she needs is a:
- Dynamic dashboard for sales reps with the following widgets:
- A gauge of total bookings
- A table of activities by meeting type
- Dynamic dashboard for managers and the VP with the following widgets:
- A gauge of total bookings
- A column chart of close rates by competitor
All users see only data that they can access. Sales reps see their own bookings and activities. Managers see bookings and close rates for the reps they manage. The VP sees bookings and close rates for the whole team. Because the metrics are the same for managers and the VP, you can use the same dynamic dashboard for both roles. The dynamic dashboards feature reduces the number of required dashboards from 45 to two!
Managers with the “View My Team's Dashboards” or “View All Data” permission can set an option to preview the dashboard from the point of view of users under them in the role hierarchy.
Set up a Dynamic Dashboard
- To store the dynamic dashboard and corresponding source reports, create a dashboard folder and a report folder from the Dashboards, Reports, or Analytics tabs. Share these folders with the intended audience.
- On the Analytics or Dashboards tab, create a dashboard or edit an existing one.
- Open the properties menu by clicking
 .
.
- Under View Dashboard As, select The dashboard viewer.
- To let users change the dashboard’s running user, select Let dashboard viewers choose whom they view the dashboard as.
- From the Properties window, click Save. Then, from the Dashboard Builder, click Save again.
When people open your dashboard, they see data as the person that you specified.
Report Charts
If you don’t want to create a dashboard, but just want to add a chart to your report, then report charts may be right for you. Report charts allow you to place a single chart right at the top of your report, so that when you view the report, you can see the chart and the report results in one view.
Here’s how you add a report chart:
- From the Reports tab, open the report you made earlier, Leads by Lead Source.
- A chart may already appear at the top of your report. If not, click the add chart button
 . You can show or hide the chart at any time by clicking the icon
  .
.
Presto! Your report now has a chart.
Conclusion
Now that you know the basics of reports and dashboards, you can start exploring and visualizing the data that’s most helpful to your business. To get more practice applying what you’ve learned, complete the Create Reports and Dashboards for Sales and Marketing Managers module. Or to learn about advanced visualization and business analytics in Salesforce, complete the Discover CRM Analytics trail and the CRM Analytics Basics module. The sky’s the limit!
Resources
- Salesforce Help: Build a Lightning Experience Dashboard
- Salesforce Help: Edit and Customize Lightning Experience Dashboard Components
- Dynamic Dashboards: Choose Who People View a Dashboard as in Lightning Experience
- Trailhead: Embed Dashboards and Report Charts on Lightning Pages