Filter Your Report
Learning Objectives
After completing this unit, you'll be able to:
- Explain the value of the different types of report filters.
- Apply filters to your reports.
- Use filter logic to add conditions to filters.

Add Filters
When you’re using the report builder to ask questions about your data, filters allow you to get more specific.
First, let’s take a high-level look at these features, and then we walk you through how to build a filter.
You can filter the data in a report using the following filter options.
Filter Type |
Description |
|---|---|
|
Standard Filter
|
Most objects include standard filters. Different objects have different standard filters, but most include the standard filters Show Me and Created Date. Show Me filters the object around common groupings (like My accounts or All accounts). Date Field filters by a field (such as Created Date or Last Activity) and a date range (such as All Time or Last Month). |
|
Field Filter
|
Field filters are available for reports, list views, workflow rules, and other areas of the application. For each filter, set the field, operator, and value. To add a field filter, use the search bar in the Filters tab or drag the field from the Fields list. |
|
Filter Logic
|
Add Boolean conditions to control how field filters are evaluated. You must add at least 1 field filter before applying filter logic. Filter logic applies to field filters, but not standard filters. |
|
Cross Filter
|
Filter a report by a child object using WITH or WITHOUT conditions. Add subfilters to further filter by fields on the child object. For example, if you have a cross filter of Accounts with Opportunities, click Add Opportunity Filter and create the Opportunity Name equals ACME subfilter to include only those opportunities. |
|
Row Limit
|
For ungrouped (tabular) reports, select the maximum number of rows to display, choose a field to sort by, and specify the sort order. You can use a tabular report as the source report for a dashboard table or chart component if you limit the number of rows it returns. |
Let’s see how Lance can tune his report results by adding a filter to show only direct customers.
- Go to the Reports, open the
Direct Customer Accountsreport, and click Edit.
- Click Filters.
- Click the Show Me standard filter, select My accounts, and click Apply.
- In the Filters tab, click Add filter.
- Choose the Type field.
- Set the filter operator to equals.
- Under Value, select Customer - Direct, and click Apply.
- Click Save & Run.
Nice job! Lance now has a report filter that shows all of Accounts where the type is Customer - Direct.
In the previous example, you used the equals operator to create a filter, but there are other operators you can use in building your reports. However, a word of caution: Watch your performance carefully when using not equals. The not equals operator can cause your report to run slowly or time out. Check out the full list of filter operators in the Filter Operators Reference.
Use Cross Filters
Now that you’ve built a filter, let’s go to the next level with cross filters. These filter types allow you to extend your reports to objects related to the original objects defined in the report type. Cross filters help you fine-tune your results without writing code or using formulas. The most common use case is exception reporting. Here are some examples that the sales team at Ursa Major Solar has requested.
-
Accounts with Opportunities: Accounts with opportunities that are stuck in the early stages of the sales cycle. Lance would like to spend the afternoon doing outreach to these accounts to see if he can move them along to the next stages.
-
Stale Opportunities: Opportunities without activities in the past 90 days. Erin doesn’t want to waste time calling these opportunities.
-
Orphan Contacts: Contacts without accounts. Lincoln Ulrich, Ursa Major Solar account executive, wants to add these contacts to accounts or scrub them away.
Let’s help Lance by creating a report with a cross filter that finds accounts with early stage opportunities.
- Go to Reports and click New Report.
- Select the Accounts report type and click Start Report.
- Click Filters, then set the Show Me filter to All accounts and the Created Date range to All Time.
- On the Filter tab, click the More Actions arrow and select Add Cross Filter.

- Select a parent object from the Show Me dropdown list. Your choice determines which related objects you see in the child object list. Select Accounts.
- Choose with as the operator.
- Select a child object from the Secondary Object dropdown or search by its name. Select Opportunities and click Apply.

- Optionally add subfilters:
- Click in the Add Opportunities Filter search box.
- Select a field. The child object in the cross filter determines the available fields. For example, if your cross filter is Accounts with Opportunities, you can use opportunity fields for your subfilter. Select Stage for our subfilter.
- Select equals for the operator.
- Under Value(s), select Prospecting, Qualification, Needs Analysis, and Value Proposition.
- Click Apply.
- Click in the Add Opportunities Filter search box.
- Click Save.
- Name the report
Accounts with Early Stage Opportunities, and accept the default report unique name.
- Click Save.
Good work! You’ve created a report that shows accounts that are related to early stage opportunities. If you want to narrow your list further, you can add additional subfilters.
Use Filter Logic
Filter logic lets you apply filters based on conditions. Say that Erin wants to focus her sales activities this week on all her open opportunities that have a reasonable probability of closing or that have a high enough amount to warrant some extra effort.
Let’s help Erin by creating an Opportunities report. First set the Close Date to All Time so you can see some data in this sample report.
Then set up two field filters:
- Amount greater than 100000.
- Probability (%) greater than 50.
With this setup, results are returned if the data matches both 1 and 2. But Erin wants to see results if the data matches either or both of the filters.
That’s where filter logic comes in. In the Filters pane, Click the More Actions arrow and select Add Filter Logic.

Change 1 AND 2 to 1 OR 2 and click Apply. Now Erin sees report results if the opportunity amount is more than $100,000 or the probability is greater than 50% .
These operations are supported in filter logic. You can use parentheses for grouping, for example, (1 OR 2) AND 3 AND NOT 4.
Operator |
Definition |
|---|---|
|
AND
|
Finds records that match both values. |
|
OR
|
Finds records that match either value. |
|
NOT
|
Finds records that exclude values. You can exclude values by using NOT in your filter logic or by using not equal to or does not contain in the filter definition. |
Lock Filters on the Report Run Page
When you add filters in the report builder, the filter values become available for selection on the report run page. The person viewing the report can select filter values that are different from the ones set in the report builder.
But what if you don’t want anyone to change the filter value on the report run page?
Erin has an opportunity report that she wants to share with the indirect sales team, but she only wants to share the data on partner opportunities, not the data on other lead sources. How can she do that? By locking the filter values.
In her opportunity report, Erin sets up a Lead Source filter with the filter value Contains Partner. She locks the filter by selecting the Locked checkbox and clicking Apply.
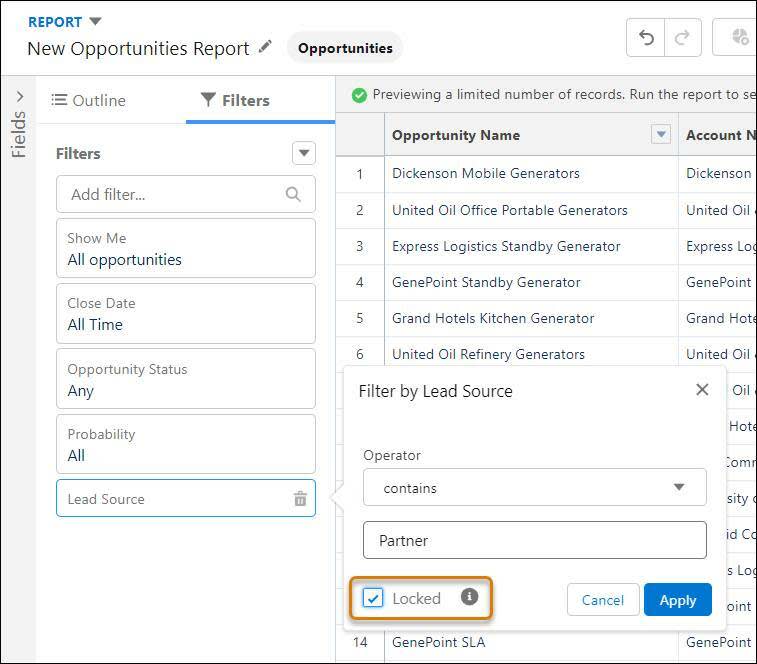
Now when she clicks the Filter icon on the report run page, the filter is shown as set and locked.

Resources
- Salesforce Help: Filter Reports by Values
- Salesforce Help: Add Filter Logic
- Salesforce Help: Set Up a Custom Report Type