Review Sheets and Tables
Learning Objectives
After completing this unit, you’ll be able to:
- Distinguish between worksheets and datasheets in the context of commission plans.
- Identify the key features and functions of various table types.
- Describe the role of sheets and tables in building effective commission logic.
In the previous units, you learned how to navigate through the Designer interface, equipping you with the foundational skills necessary for building effective commission plans. This unit introduces you to the essential components of sheets and tables, which are critical for organizing and managing your commission plans effectively.
When building a commission plan, utilizing different types of sheets and tables is essential for effective logic implementation. Understanding these components will help you streamline your planning processes and enhance your decision-making capabilities.
Worksheets
A worksheet is a foundational element in your plan-building process, providing a grid of individual cells that allows you to perform calculations and store values in a structured manner. Unlike traditional spreadsheets, worksheets are designed for more specialized uses, enabling you to create calculations that yield a single output rather than applying to rows of filtered data.

Worksheets are particularly useful for establishing global, general, or statement calculations that serve various purposes within your compensation plans. For instance, you can use a worksheet to maintain constant values, such as flat commission rates or filter criteria. This flexibility allows you to reference these values in different contexts throughout your plan.
Moreover, worksheets allow you to compile short lists of values that can be used in other calculations and filters. This feature can help you summarize key metrics, such as total meetings held by a sales development representative (SDR) or a rep’s year-to-date new business attainment.
Datasheets
A datasheet represents a set of filtered records originating from your data sources. It acts as a dynamic table where you can apply specific calculations to this curated set of data. By filtering records based on criteria relevant to your compensation plans, datasheets enable you to perform targeted calculations.

For example, you might create a filter called ClosedInPeriod that returns only those opportunities closed by a specific rep within a defined time frame. Once you have this filtered view, you can add calculations that apply solely to the data presented in the datasheet. Unlike worksheets, where calculations are more generalized, datasheet calculations are associated with individual record details and are calculated line by line. This feature allows for a granular level of analysis, making it easier to derive insights tailored to specific subsets of data.
By using datasheets, you can create a comprehensive view of your sales performance, commission payouts, and other vital metrics that directly impact your compensation strategy.
Tables
In the context of incentive compensation and commission plans, tables play a crucial role in organizing and managing various types of data and calculations. Three common types of tables you will see in Salesforce Spiff are range tables, lookup tables, and quota tables, each serving distinct purposes in your compensation structure.
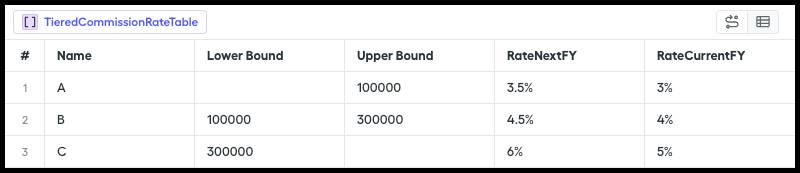
Range Table
Range tables are particularly useful for defining tiered compensation structures, such as accelerators. These tables outline performance metrics and the corresponding commission rates associated with different achievement levels. For example, a range table might specify that as sales volume increases, the commission rate also increases in defined tiers. This tiered approach incentivizes higher performance by rewarding sales representatives for reaching specific sales milestones.
Range tables also allow for flexibility, enabling you to integrate previously created worksheet calculations within the table. This means you can build dynamic compensation structures that can adjust based on changing business conditions or strategic objectives.
Lookup Table
Lookup tables are designed to retrieve specific values based on defined criteria. They are often used to assign different commission rates depending on factors like product categories or sales teams. For instance, a lookup table might indicate varying commission rates based on different teams or regions. This functionality enables precise and customized commission allocations that reflect your organization’s goals and sales strategies.

Quota Table
Quota tables serve a different yet equally important purpose in compensation planning. These tables outline sales targets for reps, establishing performance expectations and benchmarks. By defining quotas, organizations can motivate sales teams to achieve specific goals and track their progress over time. For example, a quota table may set performance targets for reps, with additional metrics to assess their performance against these goals. Quota tables not only help drive sales efforts but also facilitate data-driven conversations about performance and development.

Tables are instrumental in shaping your compensation plans by allowing for structured, tiered calculations and customizable rates. They provide a framework for decision-makers to implement targeted compensation strategies that align with company objectives and motivate sales performance.
In this unit, you learned about the various components of sheets and tables, including worksheets, datasheets, range tables, and lookup tables, and their significance in managing commission plans. In the next unit, we dive deeper into the Data Tab, where you learn how to manage and manipulate the data sources that feed into your commission plans.