Explore the Data Tab
Learning Objectives
After completing this unit, you’ll be able to:
- Explain the layout and functions of the Data Tab.
- Differentiate between data fields and data filters.
In the previous units, you learned how to navigate Designer, explored the Plans Tab, and gained an understanding of sheets and tables. Each of these concepts builds on your ability to manage, organize, and execute compensation plans with precision. Now, we will focus on the Data Tab, a critical tool for working with your data.
The Data Tab
The Data tab is where you manage and interact with the raw data that drives your compensation logic. This data flows from your CRM or is manually uploaded into Spiff. The tab is divided into two primary sections: Fields and Filters. Each section plays a distinct role in how you organize, manipulate, and utilize data within your plans.
Fields Tab
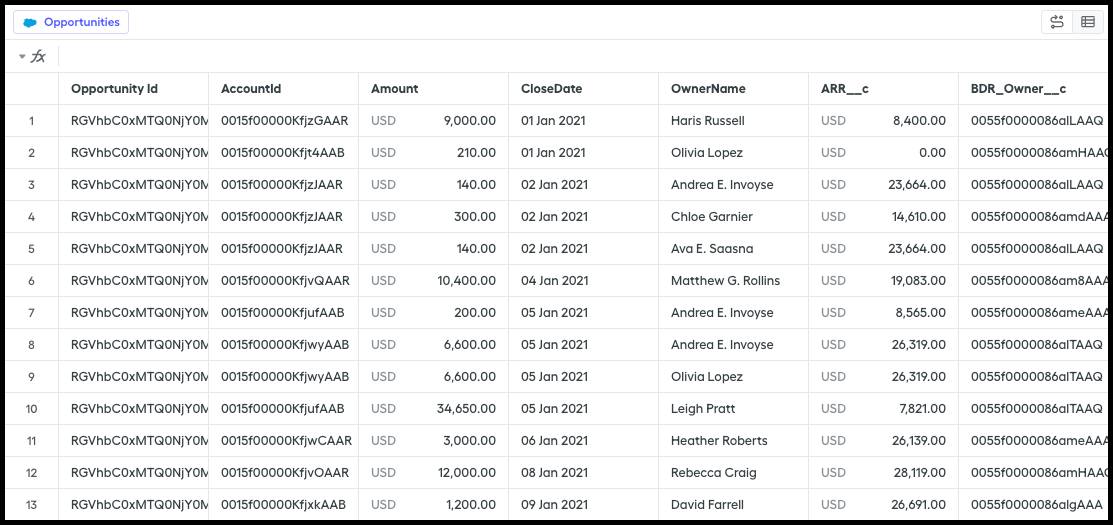
The Fields Tab contains a list of objects (or tables) synced from your source data, such as your CRM or uploaded datasets. When you expand an object, you can view all the available fields from that source. This can include standard fields from your source system or custom fields that you have created directly in Salesforce Spiff.

For example, in sales data, these fields might include attributes like Opportunity Amount, Close Date, or Salesperson name. This allows you to organize your data based on the key metrics and information relevant to your compensation plans. You can even add or remove fields as needed by managing objects in the system.
Clicking any object or field opens what is known as the Master Object Sheet. Think of this as a complete view of all fields related to that object, regardless of whether they were created from a datasheet or synced directly from your source system. This sheet acts like a library, holding all relevant data points that can be used across your commission rules, giving you visibility into the key data that drives your compensation plans.
Filters Tab
While the Fields Tab helps you organize and manage data, the Filters Tab allows you to narrow down which specific records or data sets are used within your commission calculations. Data filters enable you to create criteria that refine your data by isolating only the relevant records. For example, you can filter data to display only deals closed by a specific rep or filter sales by a particular time period, region, or product category.

By filtering this data, you can ensure that the information being pulled into your commission plans is accurate and relevant, avoiding the risk of applying commission rules to incorrect or unnecessary data.
In the Filters Tab, you can see a list of available objects or tables of data from your source system. Expanding an object shows the filters that have already been created, which helps you organize your data more efficiently. You can create new filters by selecting the object you wish to filter and defining the criteria, such as narrowing sales data to reflect only deals closed within a specific quarter.
You can also categorize your filters by using folders, allowing for a clean, organized workspace. This is especially helpful when managing multiple data filters across various plans. If a filter is no longer needed, it can be deleted. Just be cautious, as this action is permanent.
Summary
Throughout these units, you’ve built a solid foundation using Spiff Designer to manage compensation plans. You began by learning to navigate the platform, explored how to configure and manage the Plans tab, and gained an understanding of how sheets and tables function in the plan-building process. Finally, you explored the Data Tab, learning how to organize data fields and apply filters to narrow down your data filters effectively.
Together, these skills empower you to create flexible, data-driven compensation plans that align with your business needs. By understanding how to navigate the core areas of Spiff Designer, you’re now ready to tackle more complex logic and fine-tune your plans for optimal performance.