Build a Custom Data 360 Report
Learning Objectives
After completing this unit, you’ll be able to:
- Create a custom report type using related DMOs.
- Build a Data 360 report with the custom report type.
Create a Custom Report Using Multiple Data 360 Objects
After reviewing the report Michele created, Isabelle has strategies to reengage shoppers with underperforming product categories. Now, Isabelle turns her focus to other ways of maximizing website revenue.
One area she’s targeting is to convert the products in customers’ shopping carts to purchases. Isabelle has an idea that could help drive more conversions. She thinks a quick reminder about unused discount vouchers could nudge loyalty program members to complete their orders. In this scenario, shoppers pay less and NTO sees a lift in sales. A win-win opportunity!
To roll out those reminders, the marketing team needs a list of loyalty program members with items pending checkout as well as valid discount vouchers. Michele’s on it! To help the team out, she focuses on these Data 360 DMOs:
-
Loyalty Program Member DMO, which contains details about people enrolled in NTO’s loyalty program.
-
Shopping Cart Engagement DMO, which captures customers’ shopping cart activity.
-
Voucher DMO, which includes information about the vouchers tied to the loyalty program.
DMOs for the report identified? Check! But how do you tie data from all three together in a single report to get the answers you need? When you want to pull in data from multiple related DMOs, you use custom report types. They give you all the power of Lightning reports—with a setup tailored to your unique data needs.
Set Up the Relationships That Define Your Report
Before Michele creates the custom report type, she starts by defining how the data from loyalty members, cart activity, and vouchers are connected. She does this by activating the relationships between the three DMOs: Loyalty Program Member, Shopping Cart Engagement, and Voucher DMOs. This initial step lets you choose which related objects to include, how to join them, and how the report handles related records using “with” or “with or without” logic.
Here’s how Michele establishes the relationships between Data 360 DMOs step by step.
- On the Shopping Cart Engagement DMO’s Relationship tab, click Edit.
- In the Edit Relationships box, click + New Relationship.
- Set these values:
- For the Shopping Cart Engagement object, select Account Contact as the field.
- Set Cardinality to N:1.
- Select Loyalty Program Member as the related object in Data 360.
- Select Account Contact as the related field in the Loyalty Program Member object.
This relationship tells Data 360 that each cart engagement links to one loyalty member, but a member can have many engagements.
- Click Save & Close.

- Using a similar process, set up the relationship between the Voucher DMO and Loyalty Program Member DMO from the Voucher DMO’s Relationship tab.
- For the Loyalty Program Member object, select Party as the field.
- Set Cardinality to N:1.
- Select Voucher as the related object in Data 360.
- Select Account Contact as the related field in the Loyalty Program Member object.
- For the Loyalty Program Member object, select Party as the field.
- Click Save & Close.
Set Up a Custom Report Type
With the required relationships between the DMOs established, Michele can build the custom report type that brings the data together and helps the team identify customers for reengagement.
Here are the steps she takes.
- In Setup, enter Report Types in the Quick Find box and select it from the results.
- Click New Custom Report Type.
- For the primary object, select Loyalty Program Member.
- Add a name and a description for your report type.
- Save the report type in the Data Cloud category and click Next.
- In the New Custom Report Type window, relate the Shopping Cart Engagement DMO to the Loyalty Program Member DMO.
- Because you want to include only loyalty members who have shopping cart activity, select the first option: Each “A” record must have at least one related “B” record.
This option creates an inner join. So your report includes only records with related data from both DMOs. That’s what you need to identify members who recently added items to their carts.
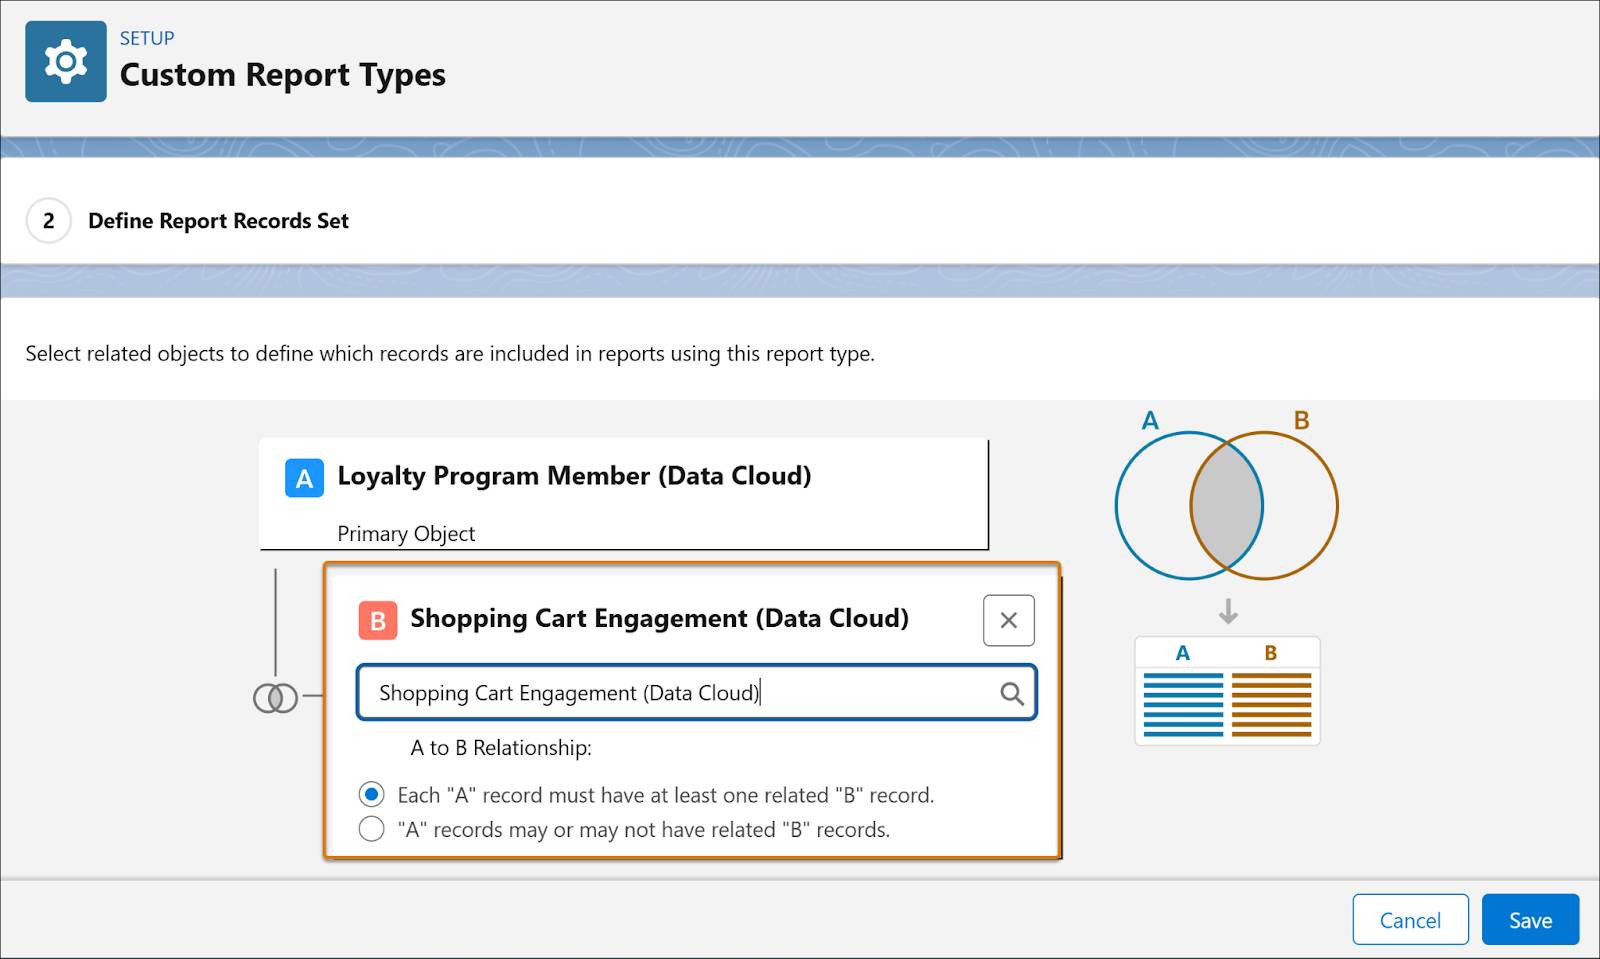
- Click Save.
Next, Michele customizes the field layout for the report type.
- In the Edit Layout panel, click + Lookup Fields.
- To include voucher information in the report, select these fields from the Voucher DMO:
- Voucher ID
- Voucher Status
- Discount Percent
- Voucher ID
These details help the team spot which vouchers are active, how much of a discount they offer, and which voucher belongs to each member.
- Click Apply.
- Add the fields to the Shopping Cart Engagement section.

- Click Save.
See Your Custom Report in Action
The report type is ready. Michele’s next step is to build the report using the report type she just created.
- In the Reports tab, click New Report.
- From the Data Cloud category, select the report type you created and click Start Report.
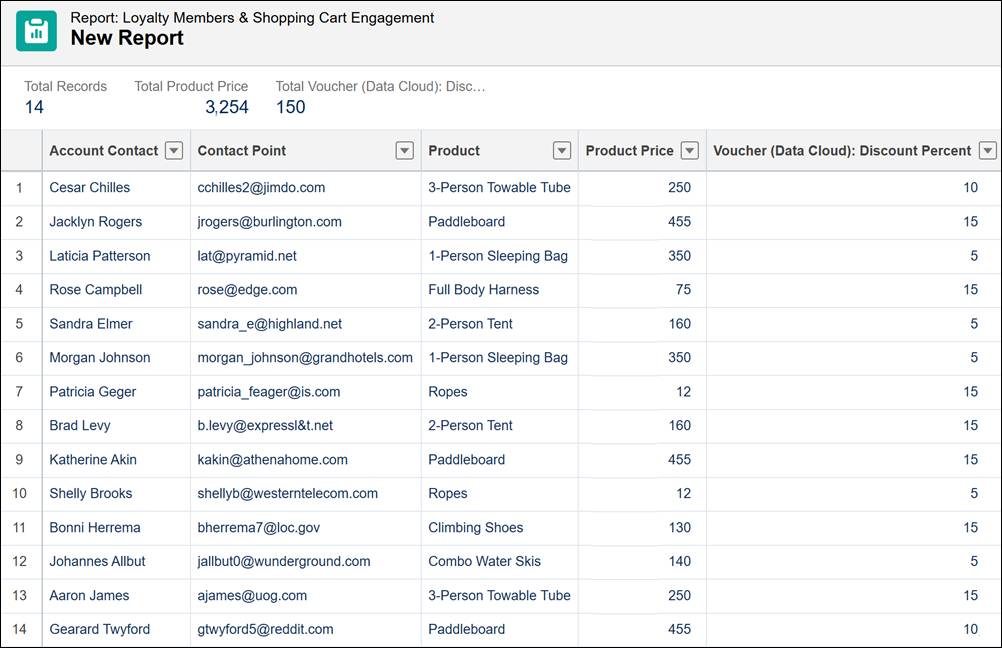
- Add the fields that provide the details you’ll use to reach out to loyalty members with voucher reminders: Account Contact, product name, and the discount available to them.
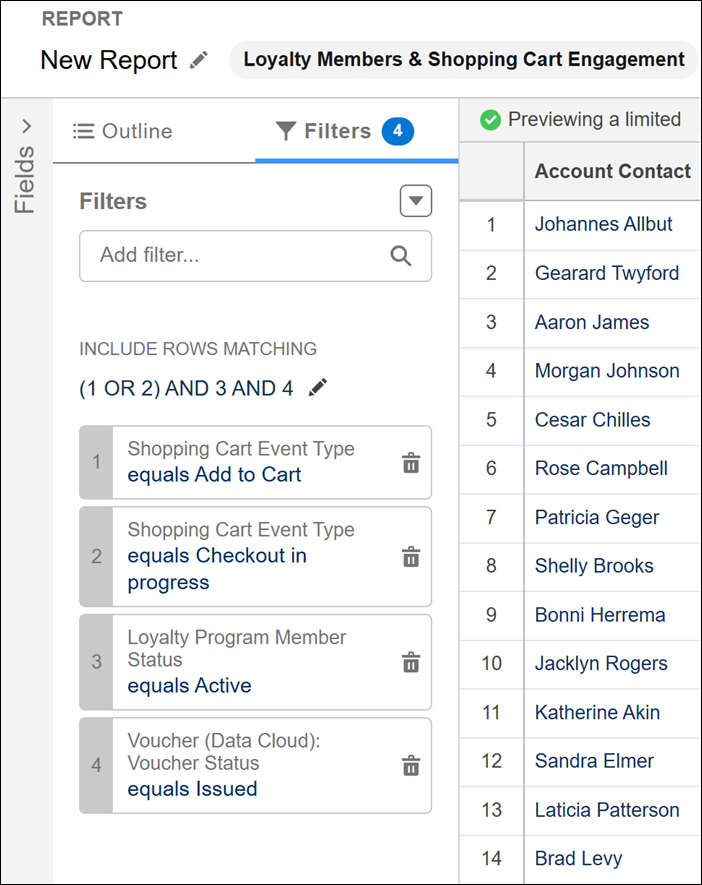
- Apply filters to narrow the report to active loyalty members who have vouchers and were in the process of buying products from your online store.
- To do that, in the Filters tab, set these filters:
- Shopping Cart Event Type = Add to cart or Checkout in progress
- Loyalty Program Member Status = Active
- Voucher Status = Issued
- Shopping Cart Event Type = Add to cart or Checkout in progress
- Run the report.
Michele has the report ready for review. She follows the instructions in this help documentation to export the report and share it with Isabelle. The team can now quickly identify which loyalty members to reach out to and turn cart activity into completed orders. This is great progess!
Turn Grouped Data into Visual Insights
Michele has another question on her mind. Is there a connection between members’ unfinished orders and the product categories they’re shopping for? To investigate, she groups and visualizes the data.
Let’s see how Michele can surface patterns by grouping the data in the report.
- In the report builder, click Edit.
- In the Outline tab, under Group Rows, from the Add group picklist, select Product Category.
Now, Michele decides to visualize the data with a chart to quickly see patterns.
- To add the chart, click
 at the top of the report.
- Save and run the report.
The report now highlights data patterns, both in table and visual formats.
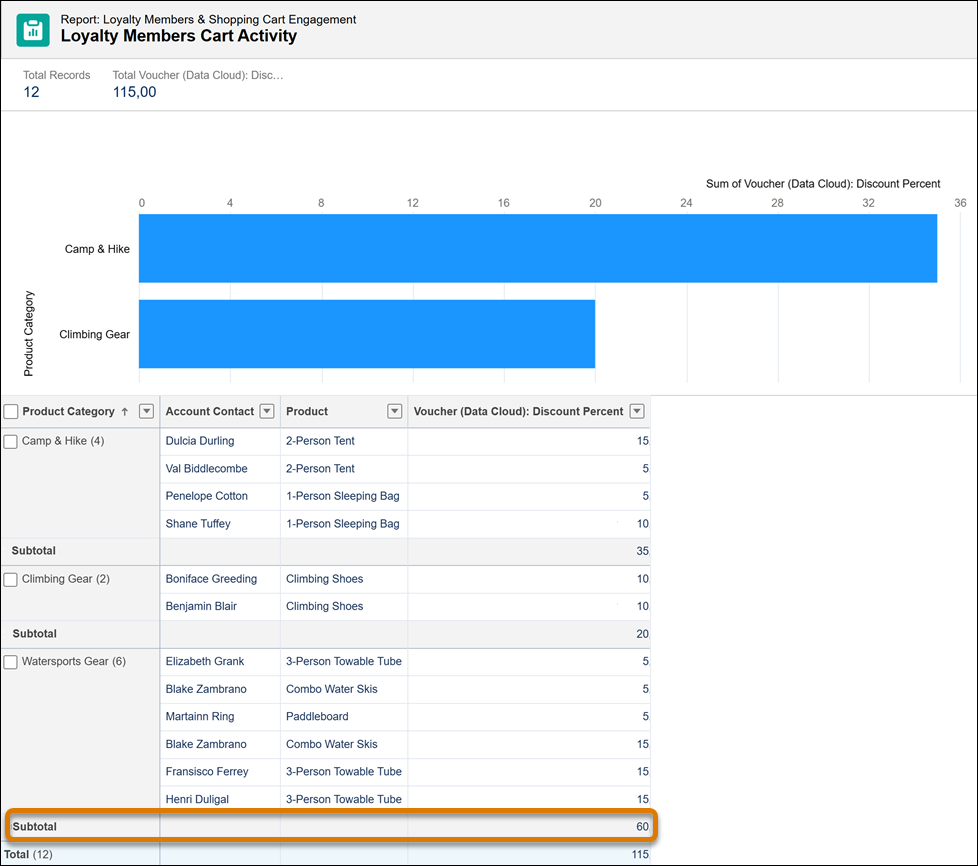
The report reveals that watersports gear has the highest rate of cart abandonment. Michele shares this finding with Isabelle, and together with the marketing team, they prioritize the watersports gear category and brainstorm ideas to re-engage shoppers and convert abandoned carts into sales.
Wrap Up
Great job! You can now build reports that provide valuable insights into your customer data. These skills enable you to make powerful data-driven decisions and execute your business strategy by tailoring reports to your specific needs, whether you’re analyzing a single object or combining multiple Data Model Objects.