Get Started with Google Analytics Reporting
Learning Objectives
After completing this unit, you’ll be able to:
- Describe the basic features of Google Analytics reporting.
- Navigate the Google Analytics home page.

Get to Know Google Analytics Reporting
When you use Google Analytics, you have access to reports and dashboards that provide you with data on your traffic, conversions, volume, site users, page views, and more.
With your Google Analytics account, you have access to out-of-the-box reports on a variety of topics, and you can filter them to meet your specific needs.
Let’s take a look at the Google Analytics home page.
Google Analytics Home Page
The home page gives you a summary of what’s interesting about your data.
The top row of cards shows you:
- Metrics for overall traffic and conversions: Users, Revenue, Conversion Rate, Sessions. Click a metric to change the graph.
- The number of users on your site right now, and which pages they’re viewing
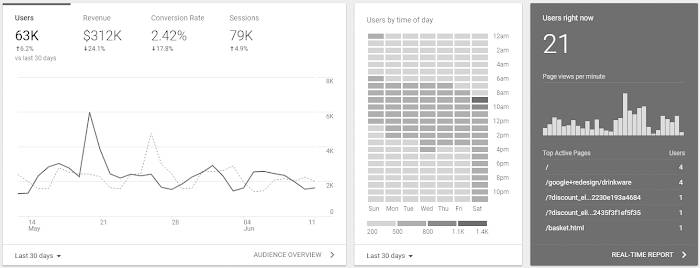
The other cards on the page provide similar snapshots of your data. For example:
- The channels by which you acquire users
- How well you retain users from week to week
- Goal completions
Card Controls
A card can have up to 3 controls.
- Dimension or metric picker
- Date-range picker
- Link to the associated report
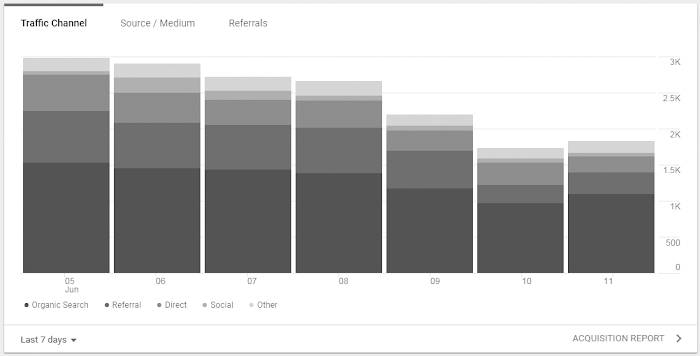
Dimension or Metric Picker
If a card lists dimensions or metrics across the top, you can click those to change which data the card displays. Some dimension choices are Traffic Channel, Source / Medium, and Referrals.
Date Range Picker
All of the cards except the real-time card, called Users right now, include an option to select different date ranges. The date ranges vary by data type, but a typical selection includes:
- Today
- Yesterday
- Last 7 days
- Last 14 days
- Last 28 days
- Last 30 days
- Last 90 days
- Last 180 days

Link to the Associated Report
Most cards use data from existing Google Analytics reports. To open the associated report, click the link at the bottom of the card.
How to Use the Home Page
The home page is a summary of your site’s vital signs. You can use it simply as a health monitor and check the page periodically to see if everything is behaving as expected.
You can also use it as the starting point for deeper investigations of your data.
For example, if you’re running new AdWords campaigns, you might be expecting a steady or even dramatic increase in the number of users over the last 7 days. If the first card doesn’t show the kind of increase you’re expecting, scroll down to the AdWords campaigns card. From there, click into the AdWords Campaigns report to investigate where the weakness might be.