Customize NPSP Reports
Learning Objectives
After completing this unit, you’ll be able to:
- Customize an NPSP report.
- Find and use NPSP dashboards.
Customize an NPSP Report
NPSP’s packaged reports are your jumping-off point to find insights in your nonprofit’s data. All you need to do is change and add filters to find answers to your questions.
For example, Sofia at NMH wants to better understand where the organization’s donations come from geographically. As part of a US-based nonprofit, she’s interested in which state’s donors gave the most over the past 5 years. To find out, she starts with a report of contacts and their giving totals and then applies groups and filters.
Let's follow along as Sofia tackles this challenge.
- From the App Launcher (
 ), find and select Reports.
- Under Folders, select All Folders.
- Select the NPSP Fundraising Reports folder.
- Select the Contacts with Giving Totals report.
- On the report, click
 and select Save As.
- Specify these details:
- Report Name:
Giving by State
- Report Description:
Contacts with giving totals, grouped by state
- Folder: Click Select Folder, then All Folders, and select Private Reports and click Select Folder in the window.
- Report Name:
- Save your work.
This makes a new copy of the report in your private folder, so you can work on it without altering anyone else’s work or the template report. Now it’s time to filter the report to show only the data Sofia needs.
- On the report, click Edit.
- On the Outline tab, in the Add group… search box in Group Rows, find and select Mailing State/Province.
- Click Filters.
- In Add filter…, find and select Last Gift Date for the contact and specify these details.
- Operator: equals
- Date: Click Use relative date and enter
LAST 5 YEARS.
- Operator: equals
- Click Apply. If you can’t see the Apply button, try reducing your screen magnification.
- In the ribbon at the top of the report table, turn on Update Preview Automatically.
- To hide details about individual donors, deselect Detail Rows to hide that information.
- Click Save & Run.
The new report displays the latest giving figures for each state, such as total gifts, average gifts, and largest gifts.
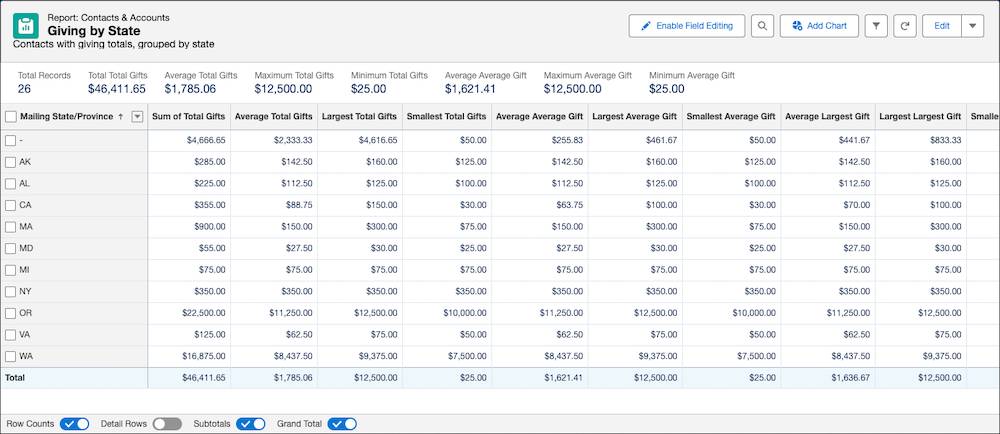
With minimal effort, Sofia can adapt an existing NPSP report to get the specific answer she needs. For example, this report can help her organization make decisions about where to focus fundraising efforts.
NPSP comes with more than 60 fundraising and stakeholder reports designed to help you answer some (though maybe not all) of your burning questions with real data. If you can’t use an existing report or customize a standard report, you can create a new one.
We won’t cover creating custom reports in this module, but you can complete the Explore Lightning Experience Reports & Dashboards trail to learn more.
Combine Reports on Dashboards
As you grow your reporting skills, you can combine your reports into dashboards. With dashboards, you get a big-picture view of your organization without having to dig through individual reports. By bringing all your data insights together in one place, you can easily see their impact on each other and your bottom line.
To get you started, NPSP includes a few dashboards by default. Here’s how to find them.
- From the App Launcher (
 ), find and select Dashboards.
- Under Folders, select All Folders.
- Select a folder with a name that begins with NPSP, such as NPSP Dashboards.
- Notice the different dashboards listed, like Development Analysis and Giving Range Analysis.
Use the dashboards to analyze and forecast donations. Plus, you can determine the return on investment for a fundraising campaign.
Build Your Reporting Skills
In this badge, you learned the basics of NPSP reports and dashboards, such as where to find reports and how to customize them to your needs. You followed along with Sofia at NMH as she found answers to her organization’s pressing questions. Now it’s time for you to do the same. Onward!
Salesforce reports and dashboards are powerful tools, and it takes some time to learn how to use them. To learn more, start with the Nonprofit Success Pack Reports Workbook, and check out the links in Resources to build your skills.
What reports and dashboards will your organization customize and build first?
Resources
- Salesforce Help: NPSP Reporting and Analytics
- Salesforce Help: NPSP Reports Workbook
- Salesforce Help: Reports and Dashboards
- Trailhead: Explore Lightning Experience Reports & Dashboards
- Salesforce Trailblazer Community Group: Nonprofit Reports & Dashboards