Discover the Power of Mapping Software
Learning Objectives
After completing this unit, you’ll be able to:
- Describe map tiles and how they're used.
- Describe how zoom levels can improve the usability of maps.
- Explain why map layering is beneficial to you.
Get Started with Mapping Software
You’ve likely used mapping software to tour a museum, discover a restaurant, or find shopping places–all from the comfort of your home. As a budding map enthusiast, perhaps you’re eager to create your very own map, but you know that locational accuracy is important and you’d rather not have to calculate the scale.
Maps are inherently mathematical and require in-depth calculations to determine the layout. But with mapping software, you can determine and replicate the layout with little to no manual calculation required. Let’s see how to harness the power of software to make your map dreams and aspirations come true.
Tile Mapping
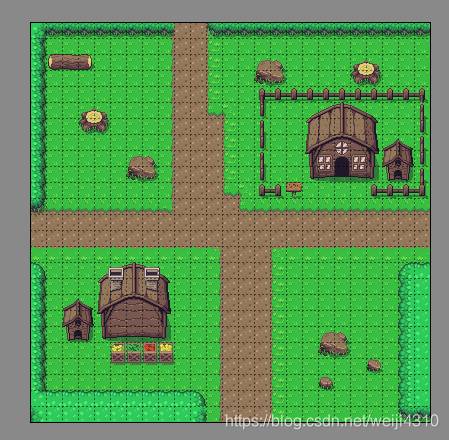
The term tile mapping may be new to some of you, but it’s not a new concept. Your favorite video game probably uses map tiles to lay out the virtual landscape. Any game with an explorative landscape uses map tiles. If you’re not too familiar with video games and prefer board games, those also use map tiles. The board game Monopoly is a classic example of tile maps. The gameplay is divided into a modified grid with different properties, and each card occupies a “tile.” The tiles represent an action or specific location that, when arranged, create the game we all know.
Tile maps are a collection of images (the tiles) displayed in a consistent grid pattern to form the background of a map. Even maps that aren’t rectangular can be tile mapped as long as the tiles have a uniform shape. The board of a board game composed of hexagonal tiles is another great example of tile mapping.
By uploading raster or vector images to software like MapBox, you can use a tile set of images to create a map background. Then, users can add other map landmarks and details to customize the map to your preferences.
Vector and raster tile sets are two common tile types. What’s the difference between them?
Raster tile sets generate an image from one end to the other at a set pace. When you print out a document from a printer, the printer uses rastering. Vector tile sets are images generated by polygons rather than uniform top-to-bottom speed. Because vector images are defined by their lines and shapes instead of by pixels, they scale more fluidly than pixel-based raster images.
Raster images that are composed of pixels tend not to look the same after resizing, as this often results in pixelation, causing the image to be blurry. Vector images scale with less distortion as the image is recalculated from the polygons and equations that define the shape. This makes them very useful as digital maps because they look better when zoomed in or out.
Compared to paper maps, software makes it easy to iterate and map things that don't exist yet. Mapping software can give you different zoom levels to let you show more details or different types of information. Match the intended use to the appropriate level of zoom to display the map data most effectively. For instance, a landscaper can increase the zoom on a map of a new park to plan the layout for a plant bed or the minimum space needed for a grove of trees. A city planner can decrease the zoom to look at bike routes to the park from different parts of the city.
Layering Tools
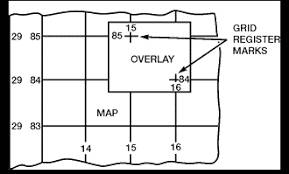
With layering tools, you can stack different elements to form a composite image–a highly effective approach for some types of maps. Layers give your map more depth and functionality by separating data of different types. You can toggle the layers on or off to display only what you need. Just like a painter, starting a map with a base layer establishes the background and limits the frame of reference. The additional layers stay within the frame, adding further detail.
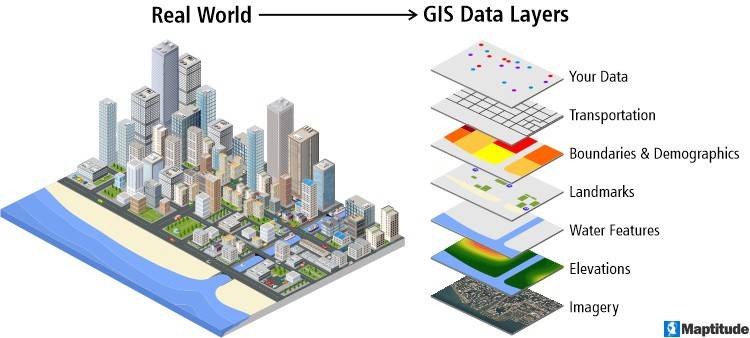
Layering satellite imagery is a common practice to create highly detailed data visualizations. Mapping software creates layers for roads and transportation networks to highlight frequently used paths and structures, or terrain and elevation for topographic analysis. These layers can be turned on or off as needed to support the data analysis. When real-world data is broken down into defined and specific layers, viewers can clearly see how factors work individually and interact collectively.
Map Tooling Software
Now that you’ve learned about the software capabilities for making complex maps, here are a few of the most popular tools.
Google Maps
One of the most well-known examples of mapping software is Google Maps, the web-based platform that receives millions of users every day. Google Maps integrates location-based services through geolocation. Google Maps has incredible functionality to plan a route from where you are (with cell service) via many different modalities. Geolocation supports the use of third-party car service applications, public transit schedule times, walking, or cycling and updates the time of arrival.
Users play an active role in keeping map information up to date. For example, imagine that you’re excited to visit your favorite restaurant, but when you get there, it’s closed for renovations. With Google Maps, you can contribute this information to the restaurant’s hours of operation to help others avoid this disappointment.
Google is a massive, popular platform that increases the way people collect and use geographical information and services. The map data interacts with other parts of the Google ecosystem through integration points and application programming interfaces (APIs).
OpenStreetMap (OSM)
OpenStreetMap is another powerful mapping software tool. This open-source geographic database is available for independent users to view, redistribute, and modify as they see fit. The license allows access to most map images and map data. The source code can be used by anyone for any purpose, including generating business sales.
OSM acquires mapping data through public records, third parties, government data, and the community. This information is added to a database and often serves as a data foundation for other third-party applications like Tableau. Many of Tableau’s maps are sourced from OSM background image tile sets (which you just learned about). These maps serve as the background for analyzing geographic data.
MapBox
As previously mentioned, MapBox allows users to create custom online maps. MapBox is geared toward style and aesthetics to produce more colorful and visually appealing maps than what you might get from other services. MapBox is more about design than map data. In fact, MapBox often uses map data and tile sets from OSM as a foundation but takes the finished look far beyond what OSM can offer.
ArcGIS
ArcGIS is a complete mapping and analysis software solution used by many government agencies and scientists. This software platform allows users to collect, scale, and share data. Through the use of geographic information systems (GIS), ArcGIS breaks down information into specific layers through a spatial database to help readers visualize data and its location on Earth. GIS is not just for geography experts. You can think of GIS as where software and science converge to help explain the world. GIS is used in a variety of fields.
- Facility management
- Transportation networks
- Incident mapping
- Demographic analysis
Cartography enthusiasts across a variety of industries beyond natural sciences can customize a map by tile mapping a specific area of it and then layering additional data on the map to accent insights.
Now that you’re familiar with mapping software, next work on the development of your cartography skills!