Add More Data to Analytics Dashboards
Learning Objectives
After completing this unit, you’ll be able to:
- Describe how Tableau CRM lets you add your own data to dashboards.
- Customize dashboards to fit your business needs.
- Share the Event Monitoring Analytics app with others.
Reports Aren’t the Only Dashboards
We’ve looked at the Reports dashboard to spot problems and trends to highlight to your chief information officer (CIO). But you know that Event Monitoring data has a lot more information than just reports, like page views, logins, Apex usage, and more. Let’s use that data to provide more insight, helping you to answer more questions.
For example, in the previous unit, you deduced that Bob Bandit ran the High Net-Worth Contacts report more than 100 times over the past month. But what about the rest of Bob’s activity in your org?
Let’s look at Bob’s page views to determine whether there’s other suspicious activity we need to know about. In this example, we’re interested in finding out the accounts that Bob has clicked on the most. To do this, we use the Page Views (URI) dashboard with some value-added data to make it easier to interpret.
Turbocharge Your Dataset with More Data
The Page Views (URI) dashboard doesn’t show account records, only URIs like /apex/SOQLQuery and/lightning. We customize the dashboard to add object names and types so that we can review which account records (if any) Bob has accessed.
But first, we add that data to Event Monitoring Analytics by creating a dataset. What’s a dataset? A dataset is a collection of related data that is stored in a denormalized yet highly compressed form. In other words, a dataset is the container for your data in Event Monitoring Analytics. To show object names and types in a dashboard, you need that data in a dataset first.
Because we are using a test org with controlled data, we don’t need to think about import limitations. But be aware that the number of records you can import into your org depends on your permissions, the type of data you’re importing, and the overall data storage limits for your organization. The type of objects you can import depends on your edition. See CRM Analytics Limits for more information.
So, let’s add object names and types to a dataset.
- Go to Analytics Studio. (It should already be open in another tab; if not, from the App Launcher (
 ), find and select Analytics Studio.)
- Click Create, then select Dataset.

- In New Dataset, click Salesforce Data.

- Name your dataset AccountDataset.
- Choose the Add to new dataflow option.
- Enter
AccountDataflow, then click Next.

- Select the Account object and click + to select Account fields.
- Select the fields Account Name and Account ID.

- Click Next.
- Select the Analytics for CIO app for your dataset, and click Create Dataset.

- You’re notified that the dataset was added to the queue. Click OK.

- Now, let’s update the dataflow. Click Update Dataflow. Once the popup screen appears, click Update Dataflow again.

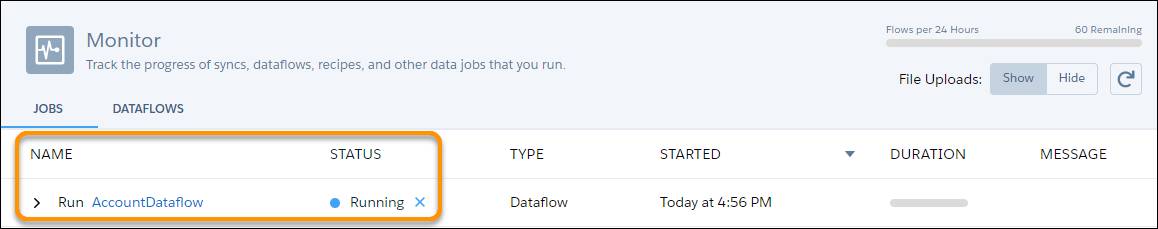
- Click Run Dataflow in the upper right corner of the page. Once the popup screen appears, click Go to Data Monitor.

- On the Monitor page, you can monitor the dataset creation.
- Once the dataset creation is successful (it can take a few minutes, and you might need to refresh your screen to see the Successful status message), go to Analytics Studio—it should already be open in another tab. Or, from the App Launcher (
 ), find and select Analytics Studio—and open your Analytics for CIO app homepage.
- Click the Datasets tab, and you should see AccountDataset at the top of the dataset list.

Great! Now you’ve got account names and IDs in a dataset. But that’s not the only data you want to show in a dashboard, right? You want the page views data in there, too.
Fortify Your AccountDataset
Let’s fortify your new AccountDataset with data from the existing URIWithUsers dataset, which is the dataset that the prebuilt Page Views dashboard uses. Salesforce has already denormalized the user IDs to make them into human-readable usernames.
- Click the gear icon and select Data Manager.

- Click Dataflows & Recipes, then click Recipes.

- Click Create Recipe and then click Add Input Data.
- Select AccountDataset as the base dataset for your recipe, and click Next.

- To join the AccountDataset with the URIWithUsers dataset, click the plus sign next to the AccountDataset icon and then choose Join from the dropdown menu.
- Select the URIWithUsers dataset from the Select Input Data page list to join it with the AccountDataset, and click Next.
- Choose the Lookup join type, and select Look Up Multiple Values for the lookup to return all matching rows from the right data streams. Then, in the Join Key fields, enter the two columns you want to correlate in your dataset recipe:
URI_ID_DERIVEDfrom the URIWithUsers dataset andAccount IDfrom the AccountDataSet dataset (the latter may be already entered), and click Add.

- To create the recipe, check the Name column at the top of the Columns view page to include all dataset columns in your recipe.

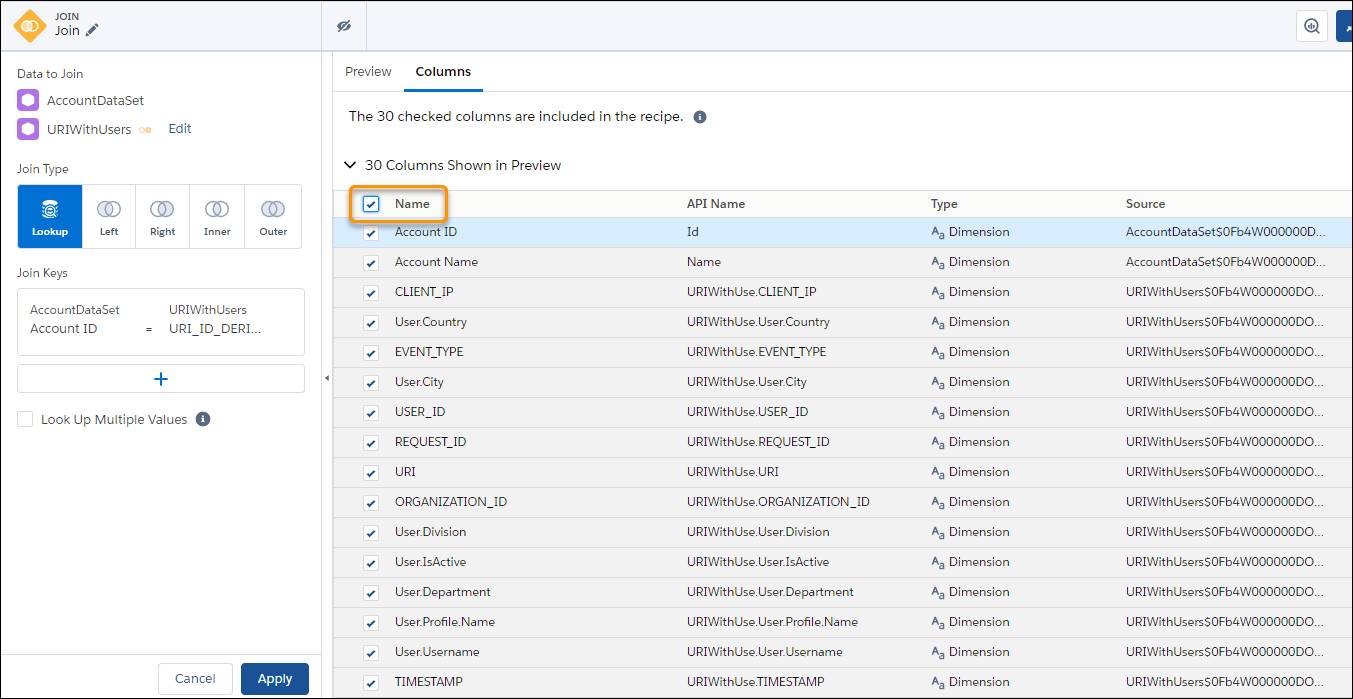
- Click Apply.
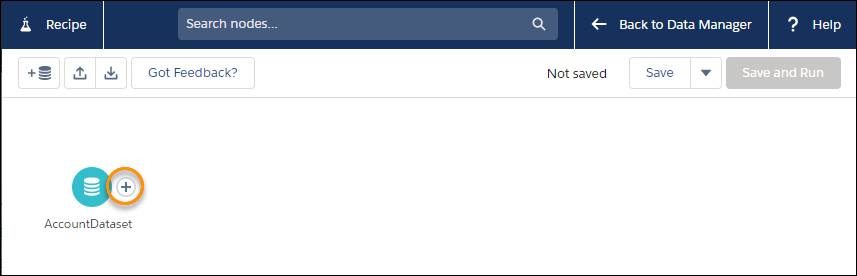
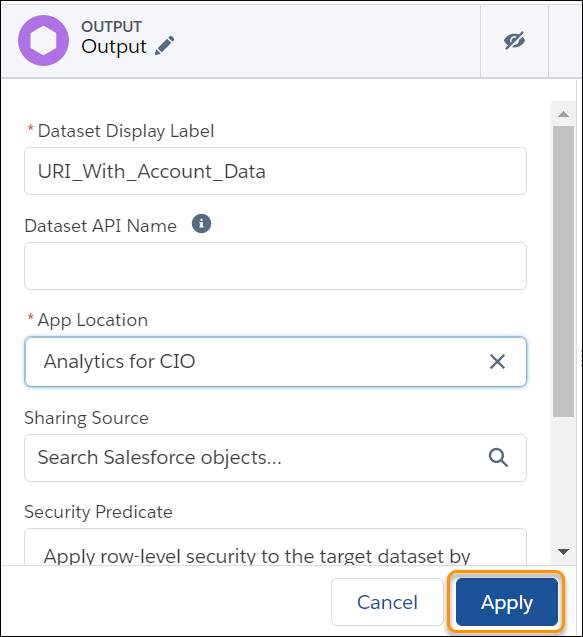
- Next, get ready to run your recipe by creating your Output node. To the right of the join node, click the plus sign and select Output from the dropdown menu.

- On the Output page, name your Dataset Display Label
URI_With_Account_Dataand choose Analytics for CIO for your App Location.
- Click Apply.
- At the top right corner of the page, click Save and Run.

- Name your recipe
Joint Account Info with URI Datasetand click Save.
- To view your run status, click Back to Data Manager.

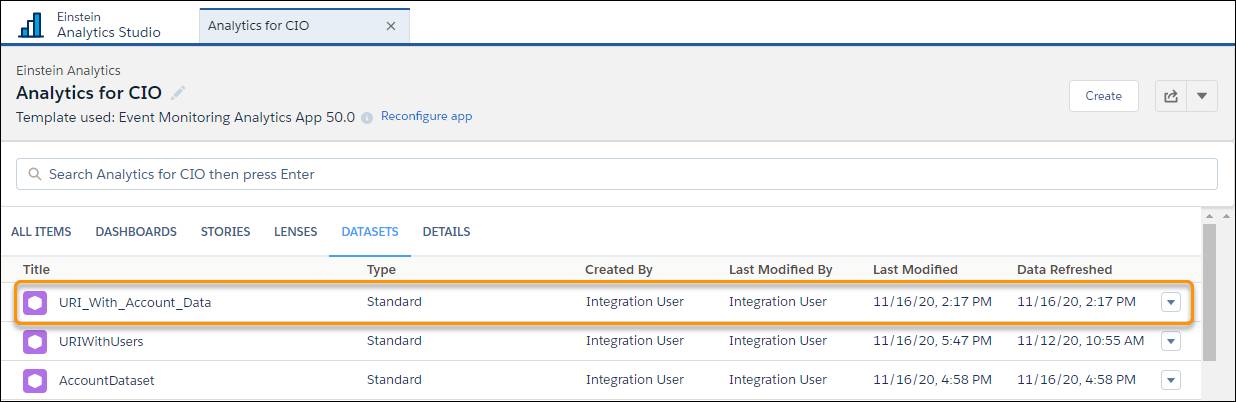
- Wait for the run to complete. It can take a few minutes, and you might need to refresh your screen to see the Successful status message. After the recipe is successful, go back to the Analytics for CID App home page.
- Click the Datasets tab, and you should see URI_With_Account_Data near the top of the dataset list.
Now you’ve got all the data you need in one dataset! Let’s show it in a dashboard.
Customize the Page Views Dashboard
First, let’s make a copy of the Page Views dashboard and name it Account Page Views.
- In Tableau CRM Analytics Studio, navigate to your Analytics for CIO app. On the app’s homepage, open the Page Views (URI) dashboard by typing
Page Views (URI)into the Search bar.
- On the More menu, click Clone in New Tab.

- Click the pencil icon next to the cloned dashboard name to change it to Account Page Views.
Next, let’s add the dataset to the dashboard and tweak the layout.
- In Analytics Studio, search for and select URI_With_Account_Data dataset.
- Next to Bars, click + and select Account Name.

- Repeat the previous step, and group by User.Name.

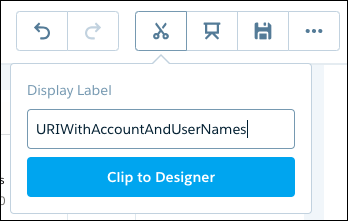
- In the toolbar, click the Clip to Designer icon and name the lens
URIWithAccountAndUserNames, then click Clip to Designer.
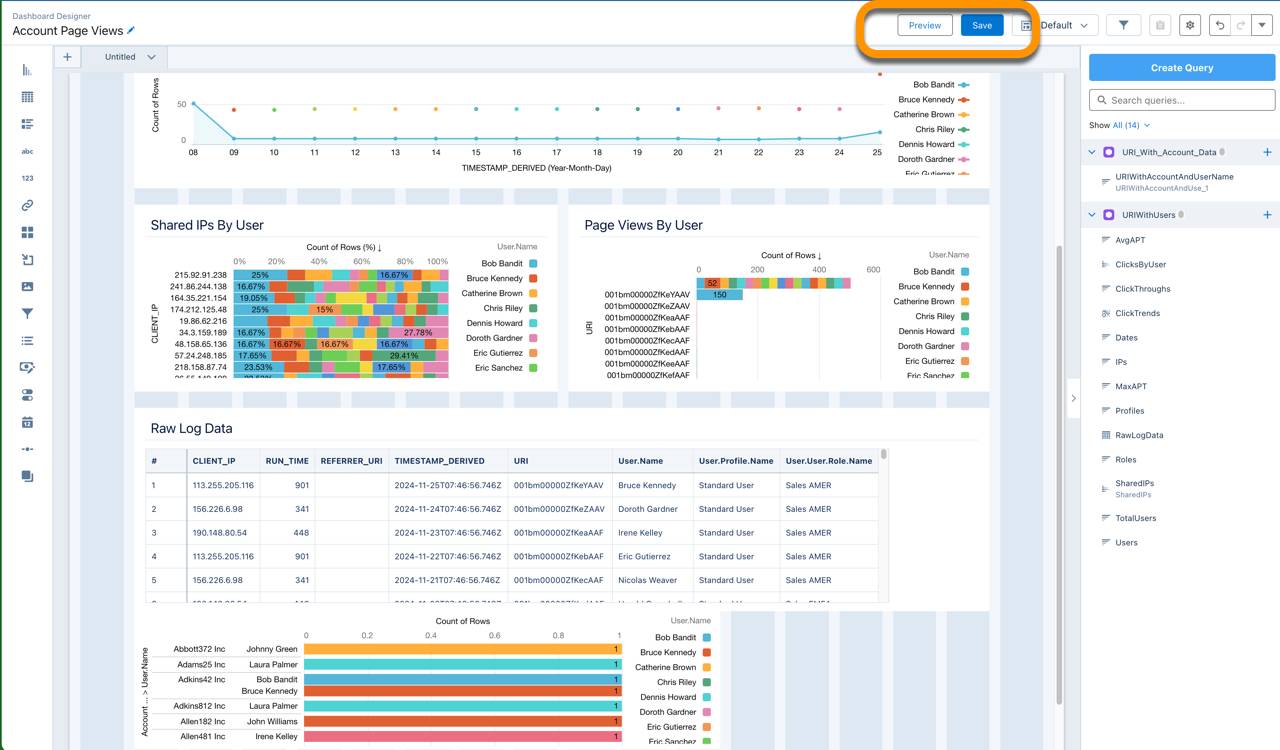
- Switch back to the Account Page Views dashboard.
- From the query list on the right, drag the URIWithAccountAndUserNames lens to where you want it displayed on the dashboard. Pressing Shift as you drag automatically moves the other dashboard panels out of the way. Resize the new panel if its default size is too small.

- In the toolbar, save the dashboard. Then click Preview to see it.
Share the App
Just one more step: sharing the app with your CIO.
- Go back to the Analytics Studio Home tab.
- Navigate to the Created By Me section, click the dropdown menu next to the Analytics for CIO app tile, and select Share from the dropdown menu.

- Search for Julie Chavez and add her as an Editor for the app, then click Add.
- Click Save. That sends an email to Julie asking her to start using Event Monitoring Analytics.
Wrap Up
Congratulations on a patient job, carefully done. Julie just sent you an email telling you about the lunch she’s going to take you to at your favorite place next time she’s in town. Awesome.
Of course, your job as a Salesforce admin is never done, and there’s certainly some fine-tuning ahead. But, for now, you can pat yourself on the back for finishing the process of creating Event Monitoring Analytics!
To up your Event Monitoring Analytics game, consider installing the Salesforce app on your mobile device. You can review your dashboards on the go, without having to be in the office or in front of a computer.