Use Einstein Discovery to Detect and Prevent Bias in Models
Learning Objectives
After completing this unit, you’ll be able to:
- Explain sensitive categories and how to select them.
- Define and interpret disparate impact.
- Define and interpret proxy variables.
- Explain model cards.
The Problem with Bias
Einstein Discovery enables businesses to explore patterns, relationships, and correlations in historical data. Through the power of machine learning and artificial intelligence, Einstein can also predict future outcomes, which allow business users to prioritize their workloads and make data-driven decisions.
Along with the benefits of this predictive power comes the responsibility of producing models that are ethical and accountable. Models that are built on biased historical data can lead to skewed predictions. Fortunately, Einstein Discovery helps you detect bias in your data so that you can remove its influence from your models.

This Quick Look explores Einstein Discovery’s safeguards that can help you identify and mitigate potential bias when designing your model. Our example uses historical invoice data to minimize the likelihood of late payments. In our example, we look at how the postal code variable can unintentionally introduce bias into our model.
Select Sensitive Variables to Analyze for Bias
When working with sensitive variables, you can mark a variable in your model for bias analysis. For example, in the United States and Canada, variables related to legally protected classes, such as age, race, and gender, face restrictions on their use. In regulated industries like employment and hiring, lending, and healthcare, discrimination against these classes is illegal.
Sometimes, a sensitive variable isn’t as obvious as race or gender. In our example, the invoice payments dataset includes postal code, which is often correlated with race. The redlining practices in the 1930s segregated America’s housing stock and continues to influence the racial and economic makeup of certain postal codes. Let’s flag postal code as a sensitive variable to see how it impacts our model.
By selecting the checkbox Analyze for bias, Einstein Discovery flags correlations between your selected variable and others in your dataset.
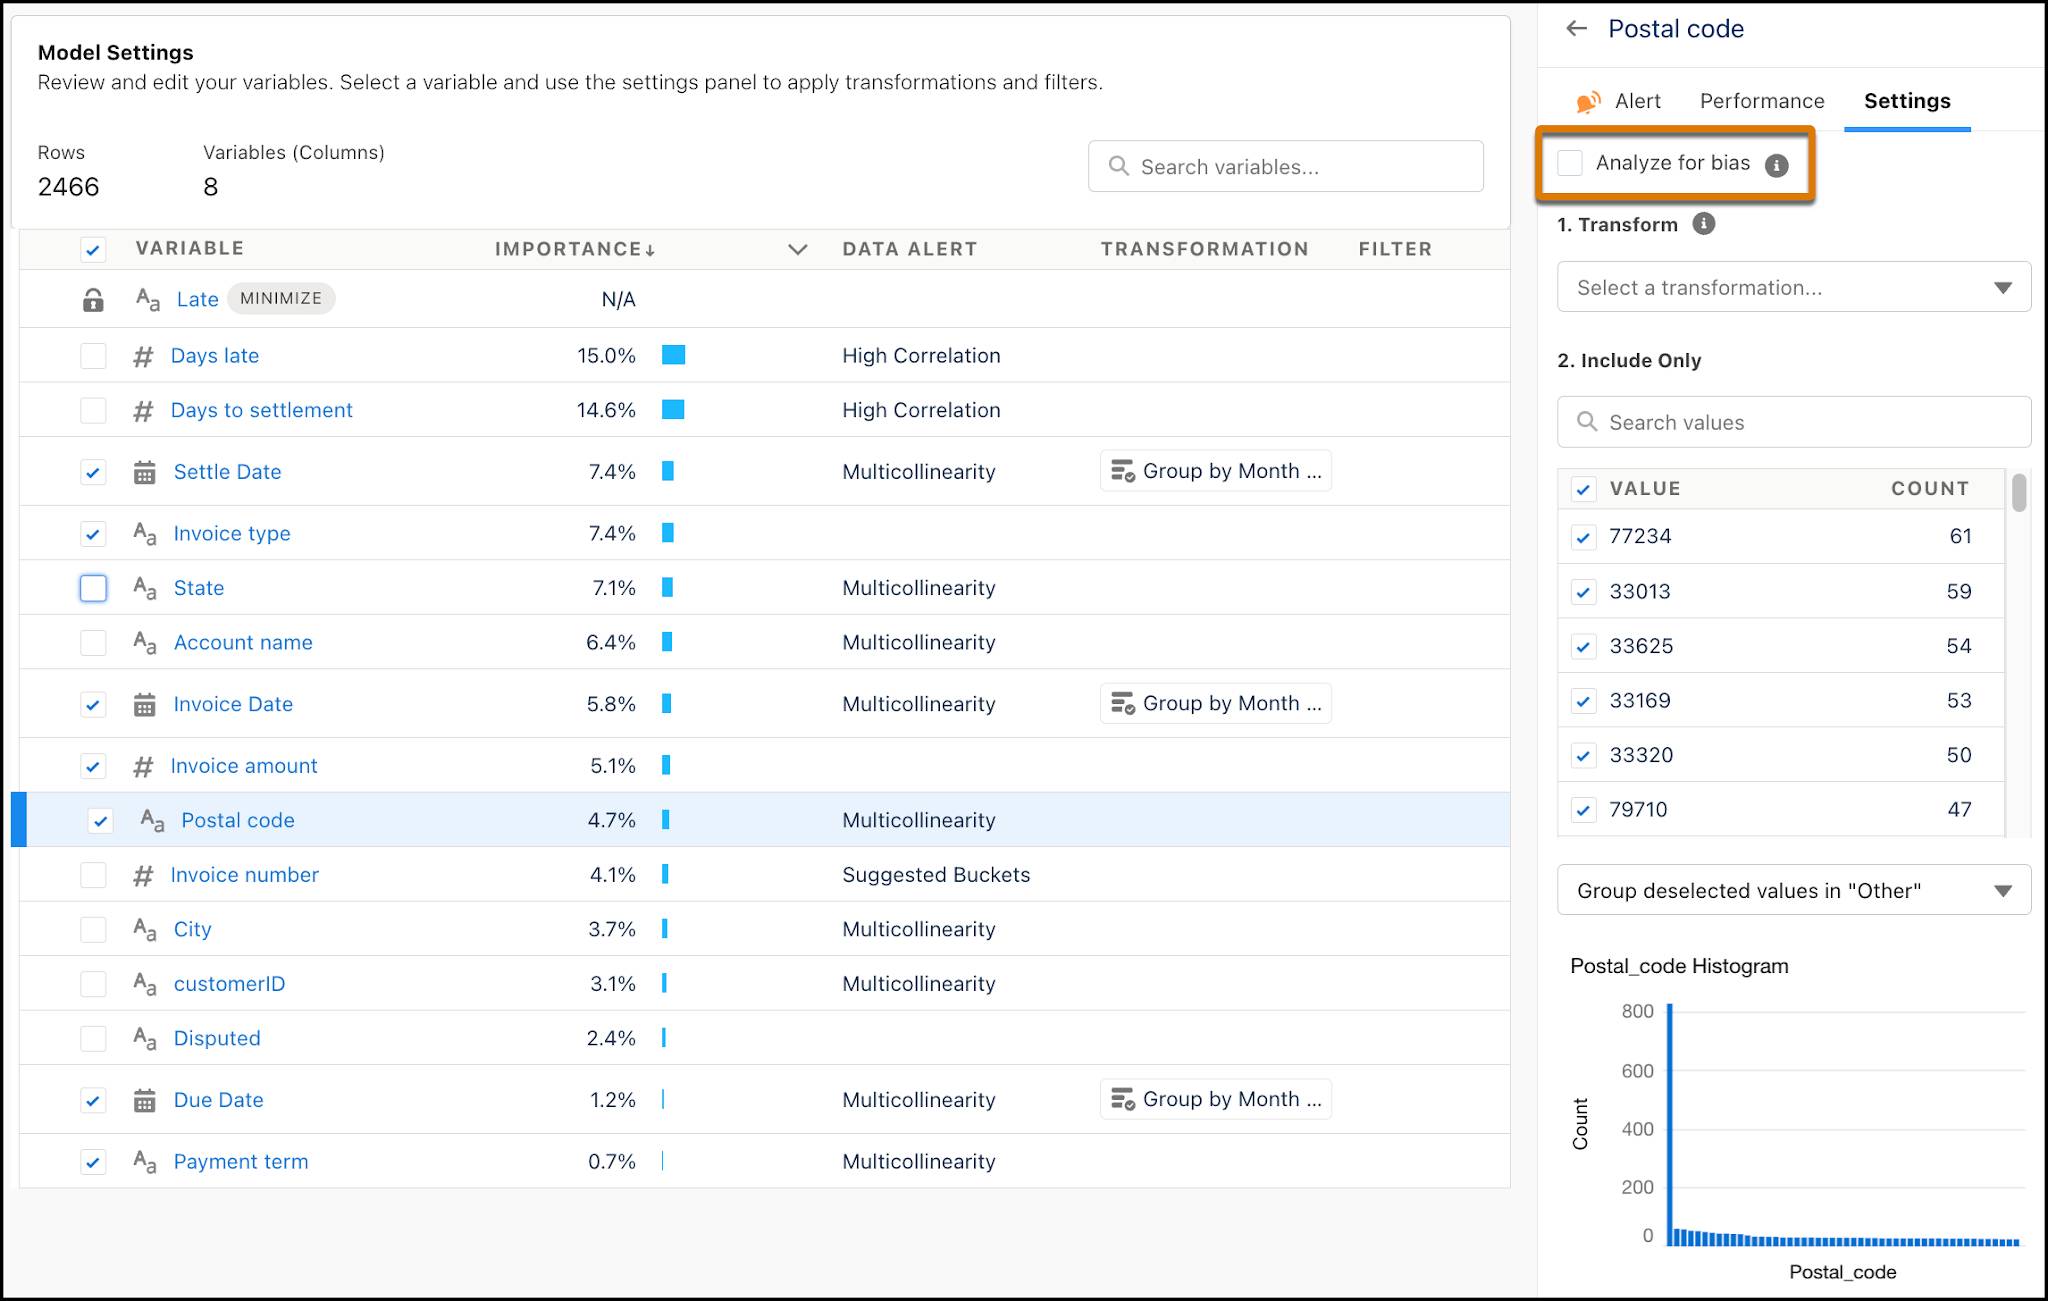
After you select the checkbox, click Create Model (or, if you've already created the model, Train Model). Based on its analysis of postal code, Einstein Discovery reports its findings for disparate impact and proxy variables. Let’s discuss what these terms mean.
Interpret Disparate Impact
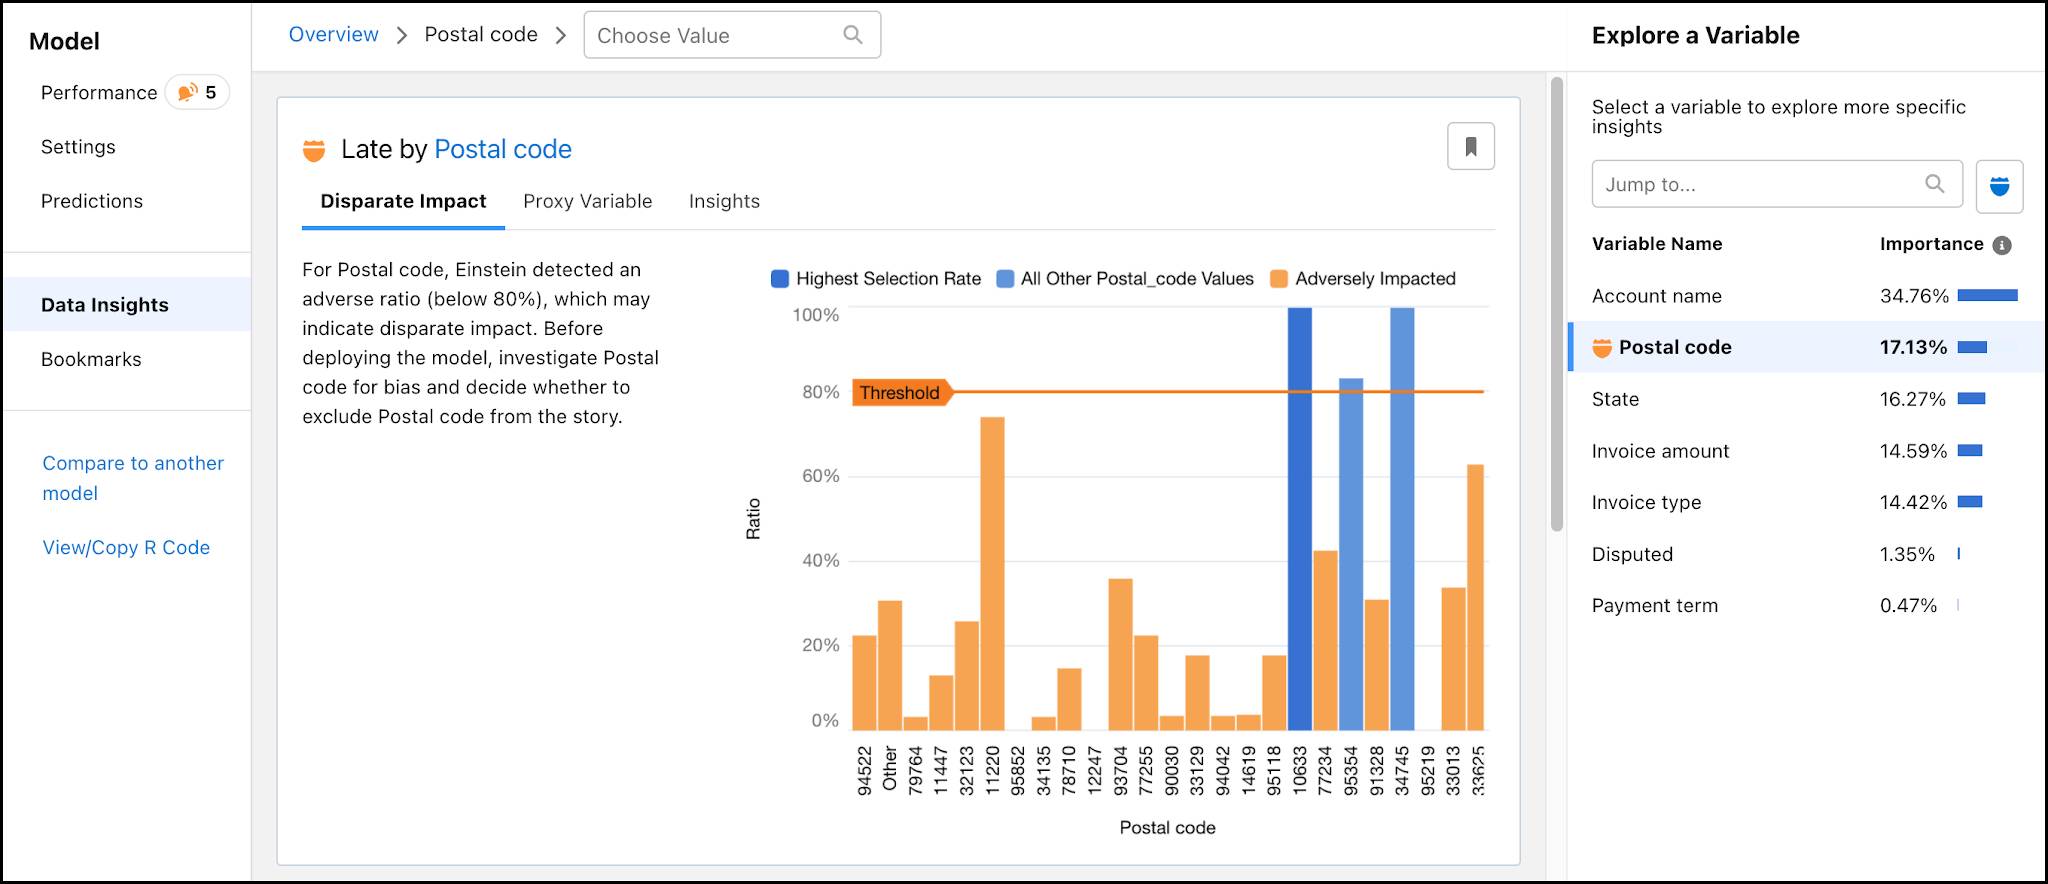
If Einstein Discovery detects disparate impact in your data, it means that the data reflects discriminatory practices toward a particular demographic. As an example, your data can reveal gender disparities in starting salaries. Einstein Discovery calculates a threshold value for what isn’t discriminatory and scores other groups relative to it. Regulated industries require a disparate impact calculation of at least 80% and higher. Removing the detected variable from your model can produce more accountable and ethical models and, by extension, predictions that are fair and equitable.
In the case of our invoice data, Einstein Discovery identifies the reference group as the postal code with the highest percentage of customers that pay invoices late. That value is considered to have an adverse ratio of 100%. Einstein Discovery calculates the likelihood of late payments for each postal code against the reference value. For example, let’s say the reference is that 75% of customers in postal code A pay late invoices. In postal code B, 45% of customers pay late. To calculate postal code B’s adverse ratio, divide 45/75. Its ratio is 60%.
In addition to the reference group, the disparate impact graph highlights the postal codes that fall below the 80% threshold. In those regions, customers are significantly less likely to be correlated with late payment than in the reference group. Postal code may result in disparate impact; including it in our model might introduce bias.
Explore Proxy Variables
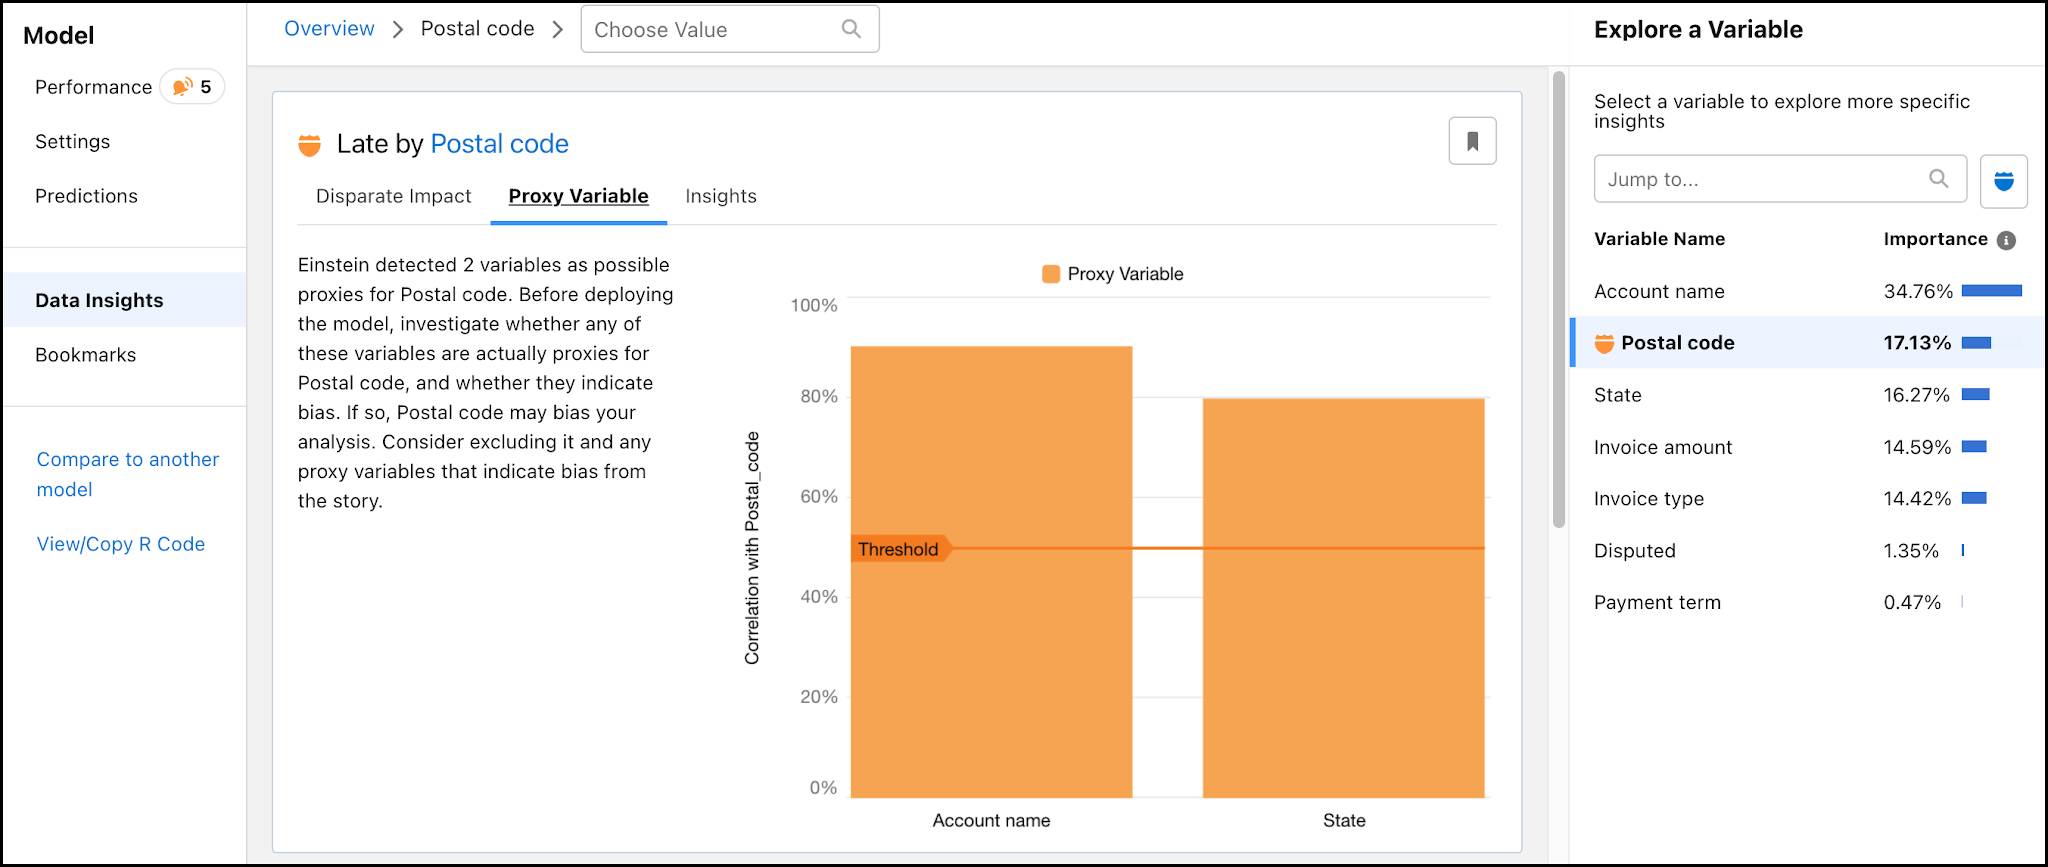
Proxy values are other attributes in your dataset that are correlated with sensitive variables. Here, Account Name is a 90% proxy for postal code. From such a strong correlation, we can infer that many of the postal codes that Einstein Discovery identified as most likely to pay late were due to the postal code being associated with one Account Name.
Clarify Predictions with Model Cards
With so many available options for making predictions, it can be hard to distinguish which model is best suited for a particular context. A model card is a brief document with important details about intended use, design assumptions, audience, limitations, and statistics related to its training data. Being transparent allows users to select the most appropriate model for the predictions that they want to make.
Einstein Discovery generates a model card which serves as documentation for your model. The card is a template you can fill in to highlight what decisions went into building your model, such as the variables you dropped and why. The template also includes model statistics associated with the data used to train the model, such as model quality ratings, the distribution of outcome values in the training dataset, and variable correlations with the outcome.
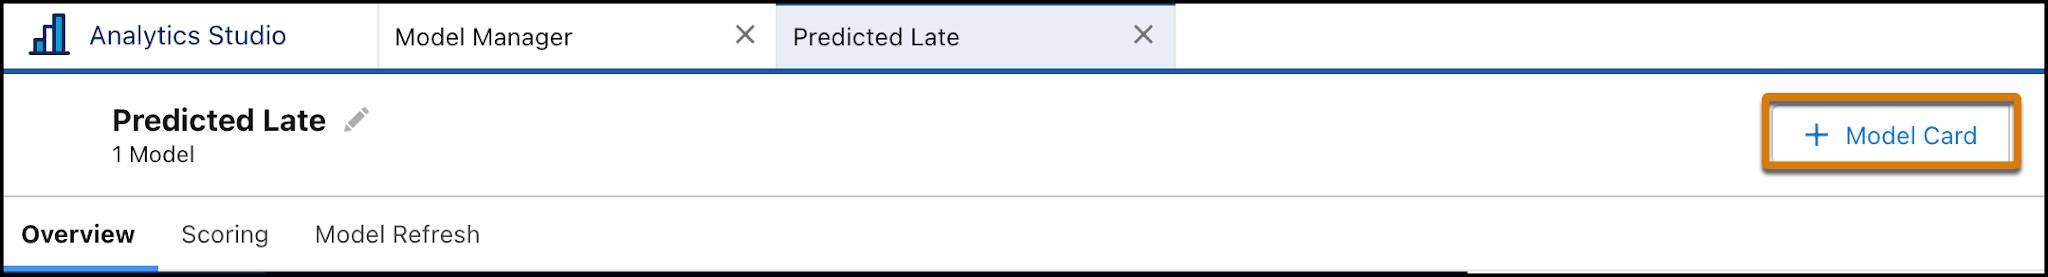
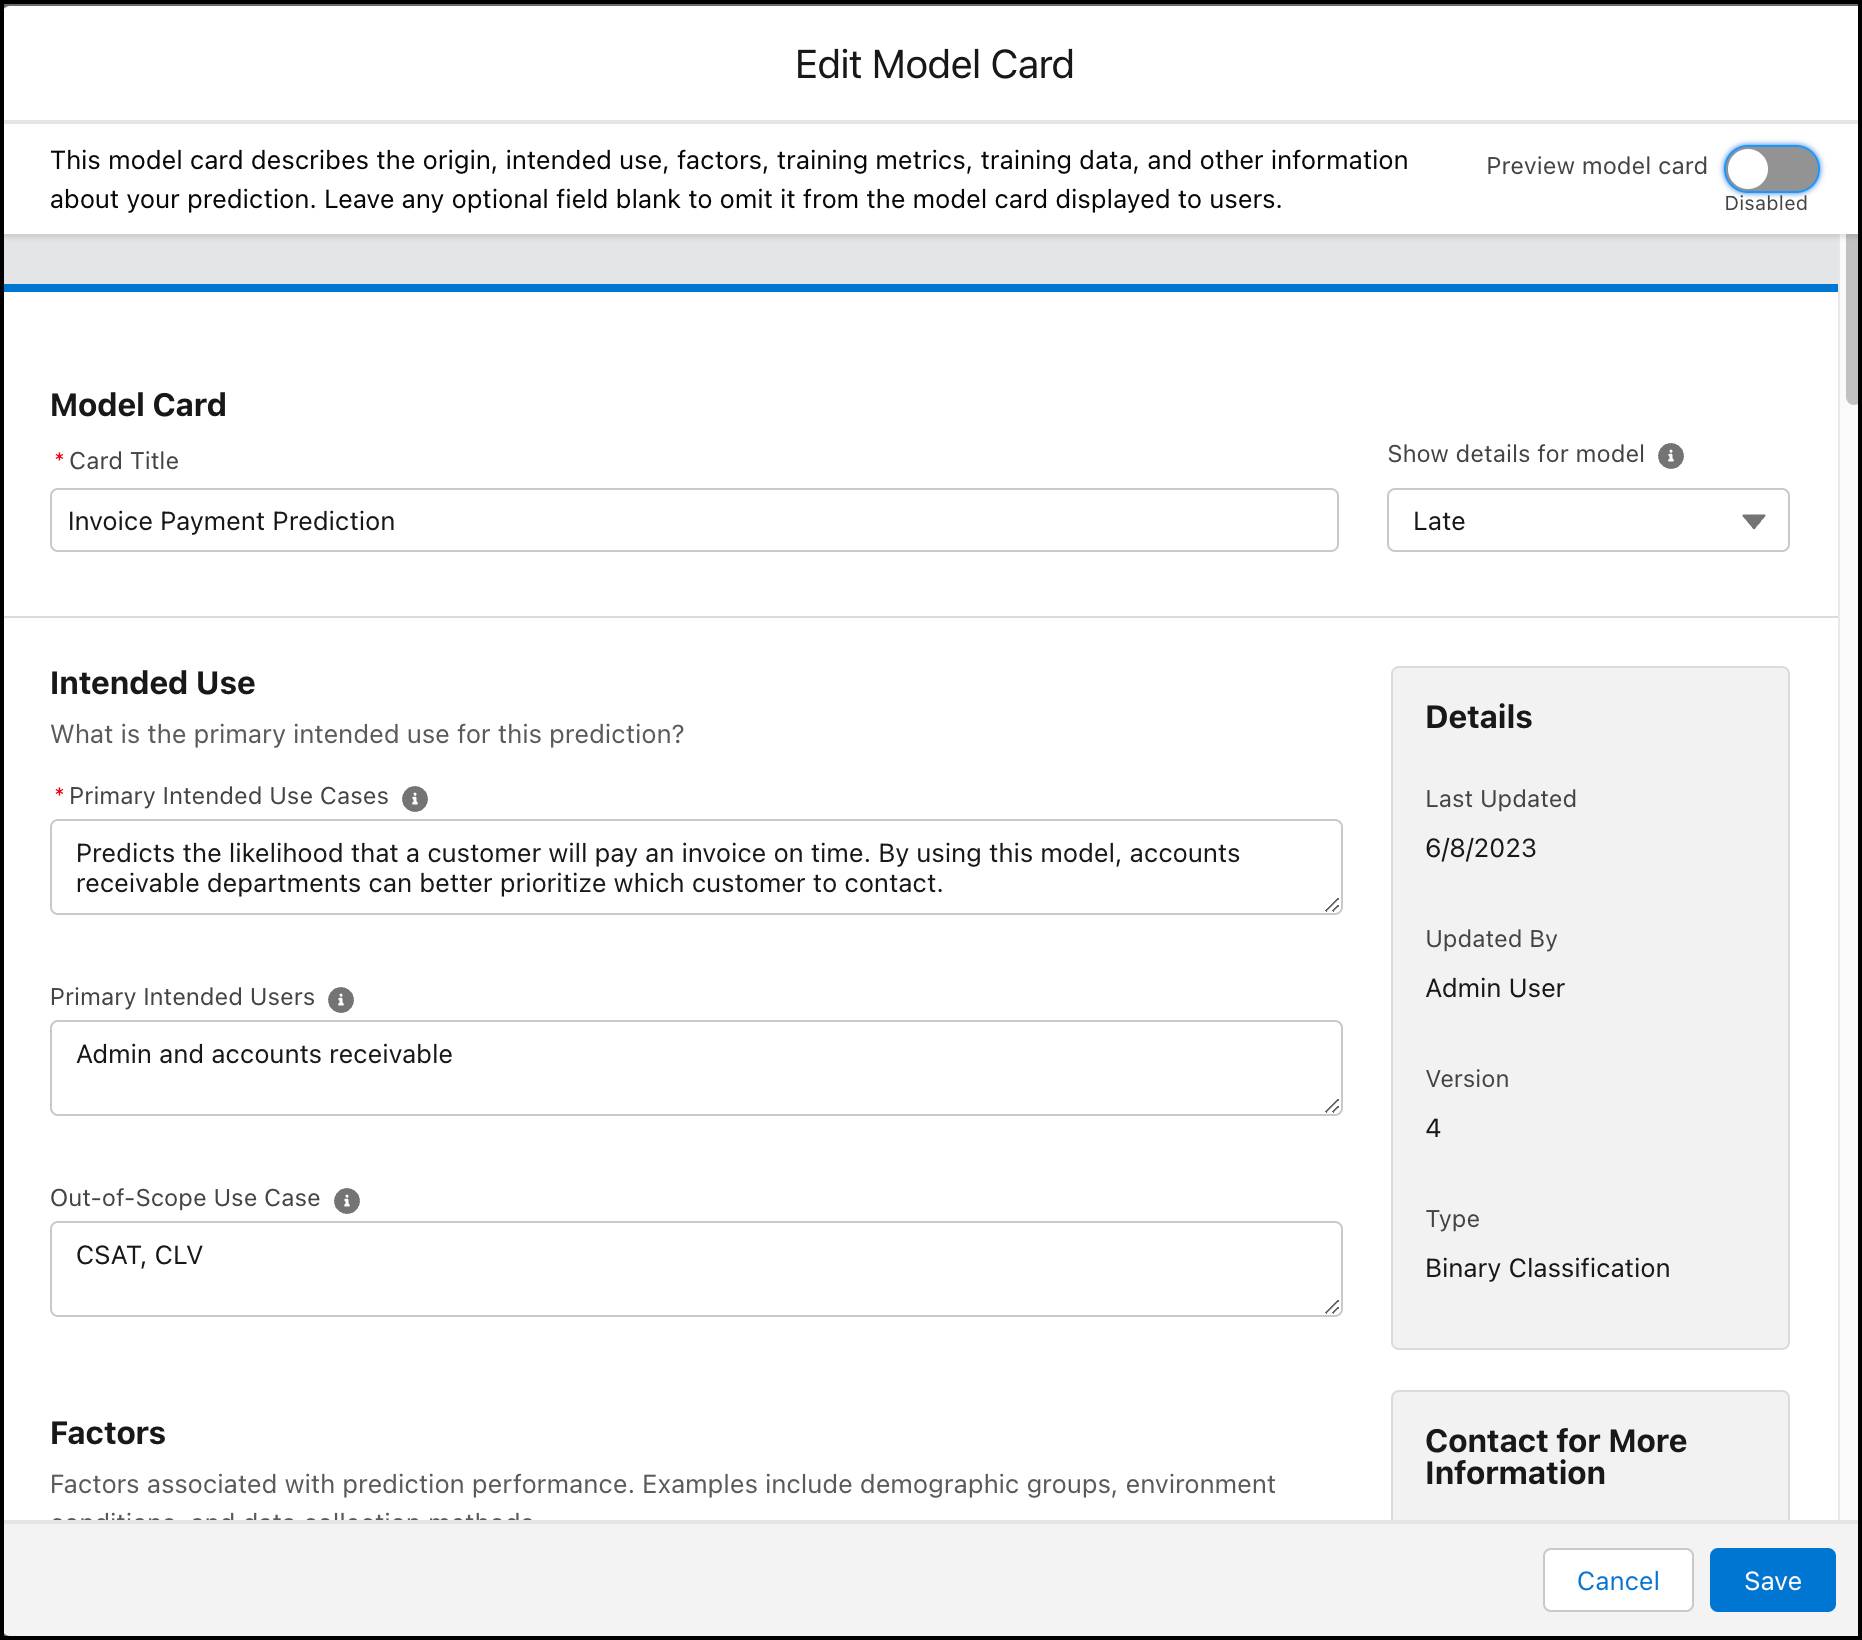
To create a model card, from Model Manager, view a prediction and click + Model Card.
In the template, complete any fields that you want to show to users, such as Primary Intended Use Cases and Ethical Considerations and then save your work. If a prediction has multiple models, select a model from the list to show its details.
In the Ethical Considerations section of our model card, the disparate impact graph is automatically included. There’s also a space to share any additional information.
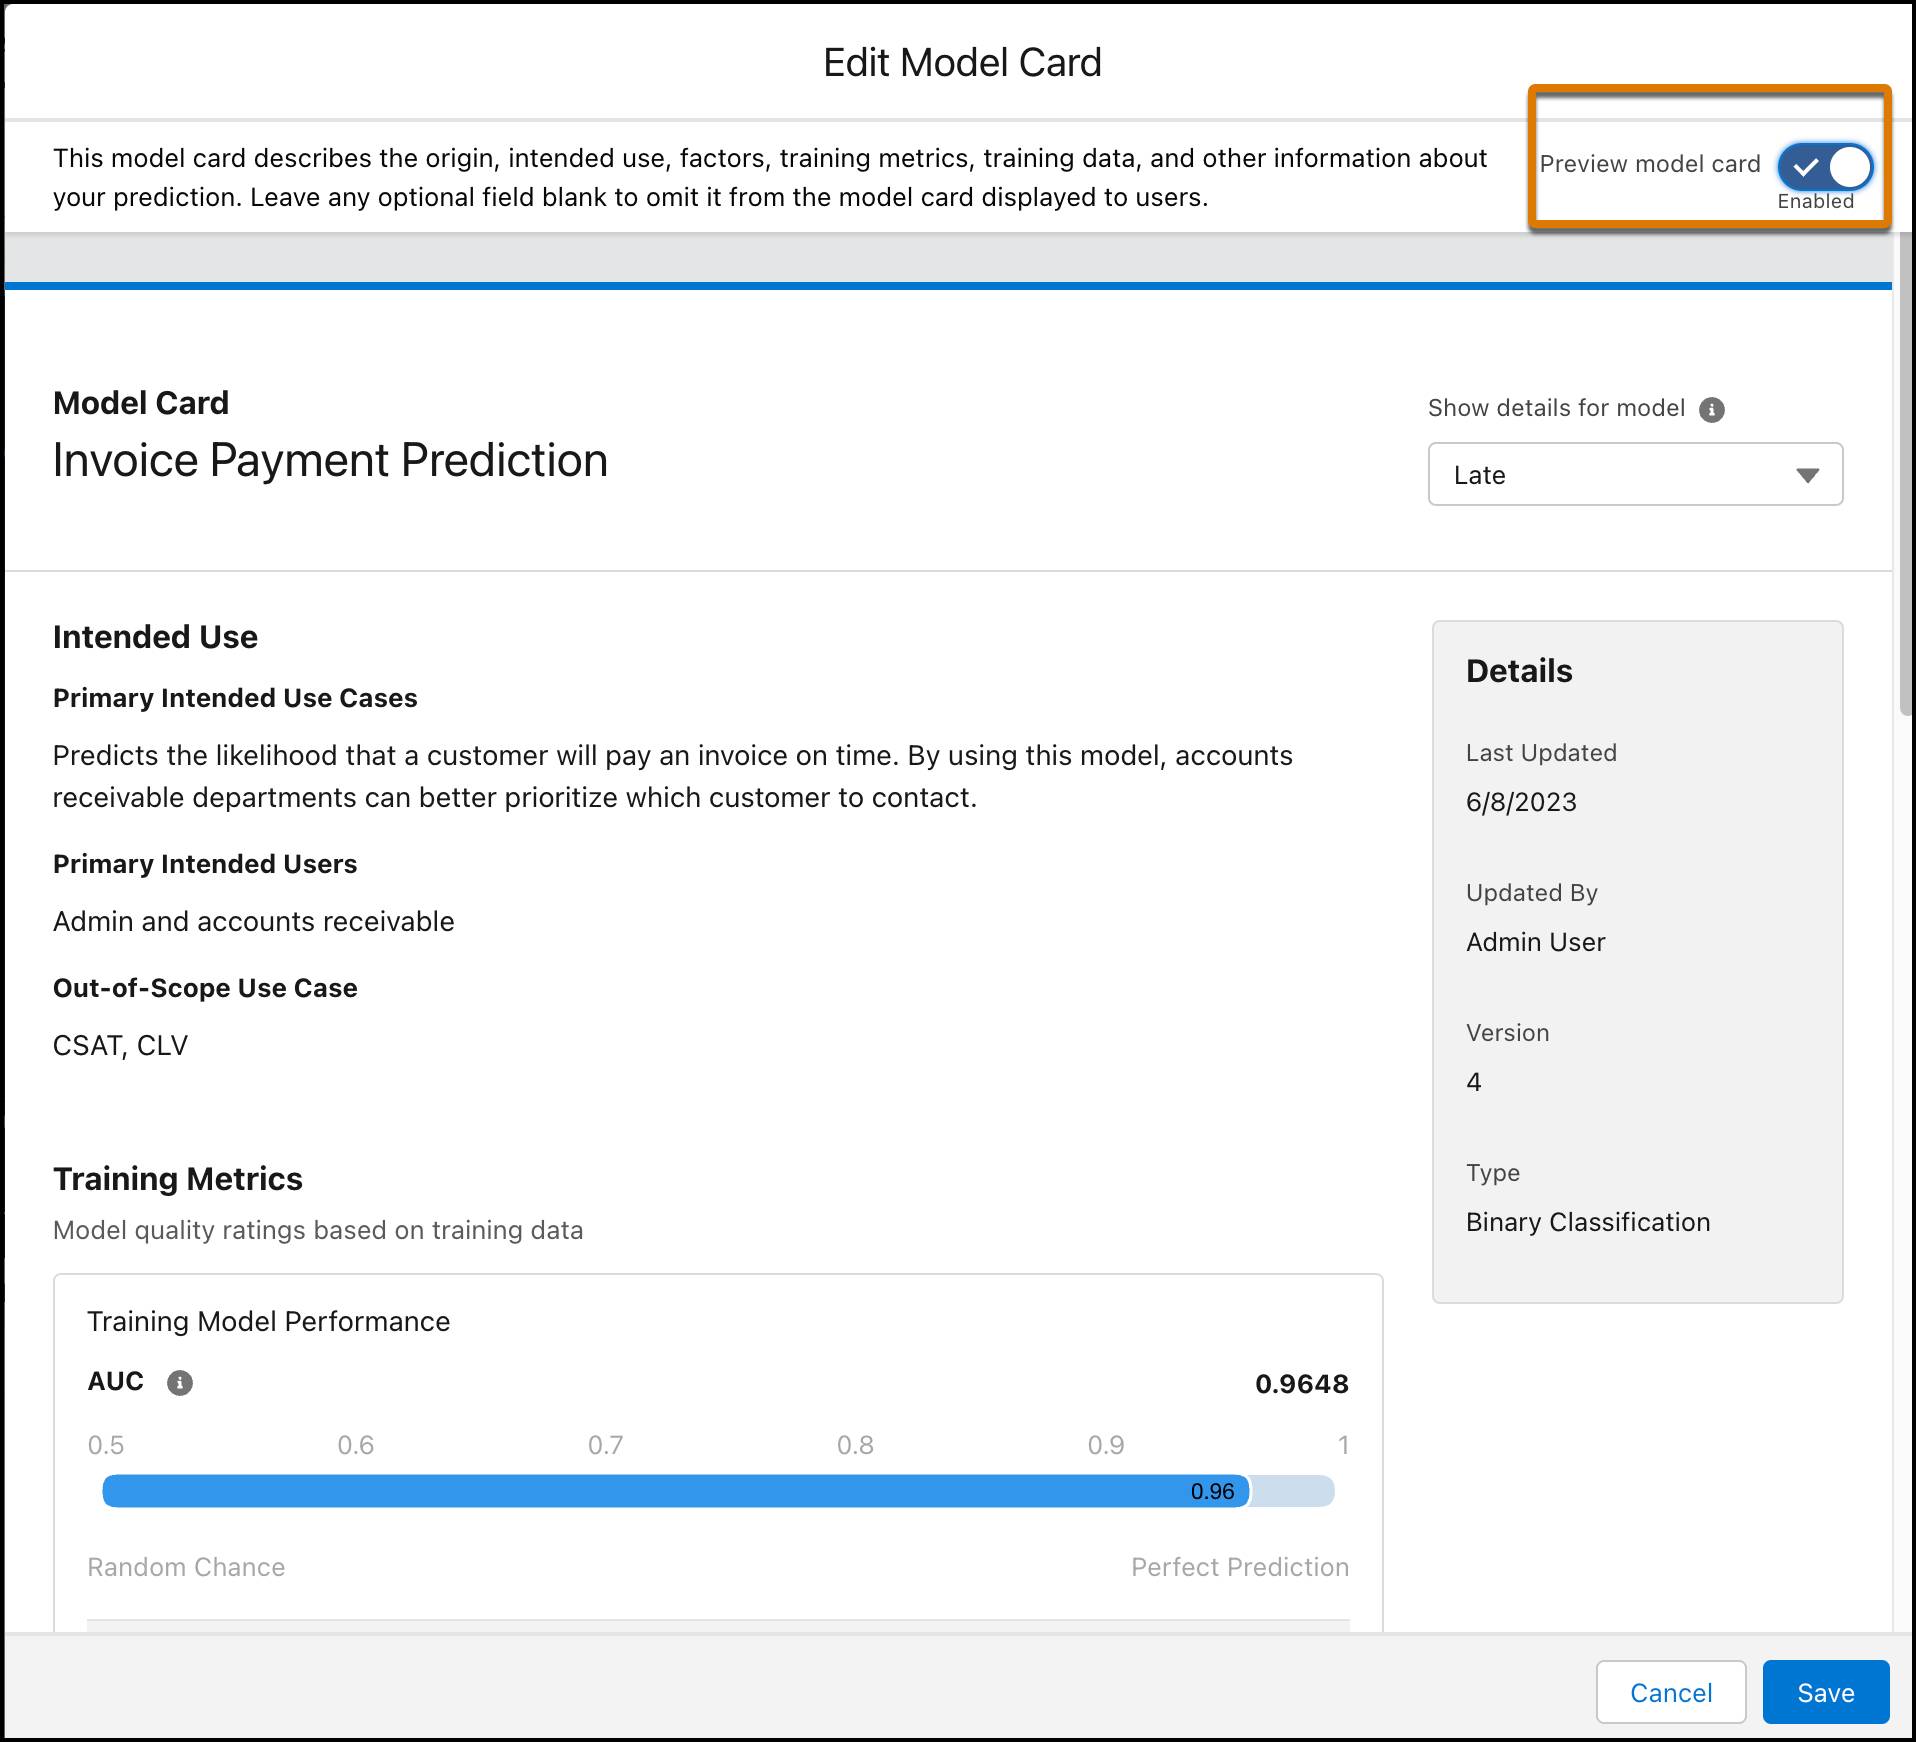
To preview your card, select Preview model card. Only completed fields appear—empty fields are omitted.
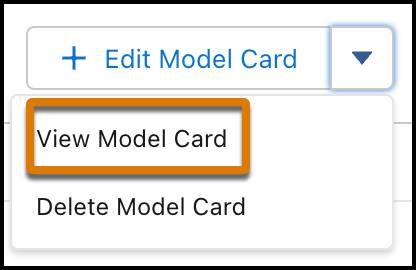
Once you’ve completed your card, click Save. To view your model card, select your model from Model Manager. From + Edit Model Card, select View Model Card.
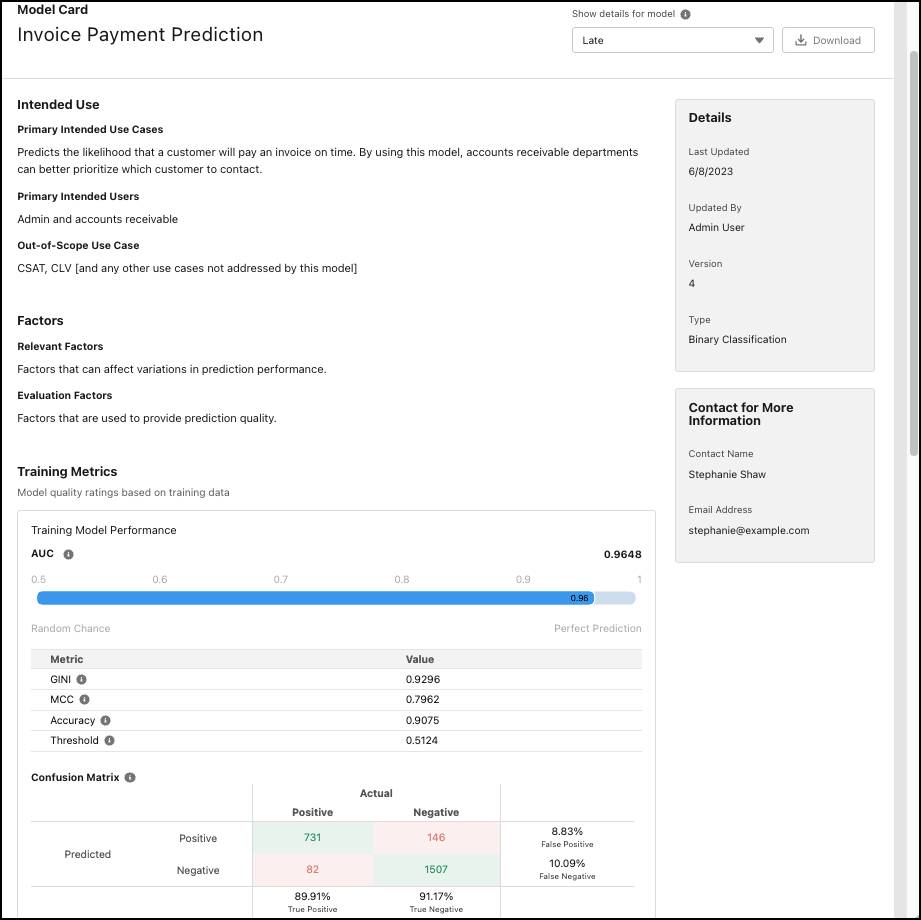
Here is the final model card.
Conclusion
Models in Einstein Discovery help you get a comprehensive picture of your data, which is as much about business results as it is about the political and social structures that influence them. With sensitive variables, disparate impact, proxy variables, and model cards, Einstein Discovery lets you take a proactive approach to bias to build models that are both accurate and equitable.
Resources
- Trailhead: Responsible Creation of Artificial Intelligence
- Trailhead: Gain Insight with Einstein Discovery
- Blog: How Salesforce Infuses Ethics into Its AI