Consider the Data Source
Learning Objectives
After completing this unit, you’ll be able to:
- Discuss the context of your data.
- Identify questions to ask about your data.
- Explain why who is or isn’t included in your data impacts your analyses.
Eliminate Bias in Data
Just as trying to analyze flawed data generates flawed results, trying to visualize flawed data will also generate misleading and deceptive dashboards and charts.
When thinking about doing no harm, check your data for ways it may be biased, or the product of racist or oppressive data collection systems. If the data underlying the visualization is biased, the visualization will amplify that bias and the harm that bias generates.
How do you eliminate bias from data analysis? By embedding an equitable perspective into a project from the beginning. Ask:
- Who are the team members involved in creating the analysis?
- Is the team or organization diverse?
- Are diversity, equity, and inclusion (DEI) issues paramount?
- And are these issues familiar to the team/organization?
Closely examine how a study is designed, how the data is collected, and how the analysis of that data is conducted and the results communicated. This isn’t a magic fix, but this broader perspective can be instrumental in removing bias from research, analysis, and communication of data.
Recognize Bias in Your Data
A solid framework for approaching data can help data analysts, communicators, and researchers identify and handle potentially biased data. Consider the following questions.
- How was this data generated?
- Why was this data collected?
- Whose voices, lives, and experiences are included, and whose are excluded from this data?
- How much can this data be disaggregated by race, gender, ethnicity, and so forth?
- Is the data demographically representative?
- Who stands to benefit, and who might be harmed by the collection or publication of this data?
Data, particularly data collected about people, is not neutral or objective. It reflects the conscious and unconscious biases and point of view of the researchers or data collectors. This point is important because applying a DEI lens alone cannot fix biased data or analyses. As a researcher, analyst, and data communicator, it’s essential to consider the root causes of the disparities revealed in the data, and frame your work with that information in mind.
Make Inclusivity a Priority
It’s important to acknowledge who is and is not included in your data and visualizations. As a researcher, can you help your organization conduct surveys to be more inclusive? Just because it may be harder to obtain data about certain groups doesn’t mean you shouldn’t still try to better understand their lives.
Groups whose data is not collected or shown often reflect who society deems least important. Conversely, what you ignore can reveal hidden social biases and indifferences. Cartography shows us a prime example of this: Maps of the United States frequently do not show US Territories, effectively erasing whole populations who have no representation in Congress and are predominantly nonwhite.
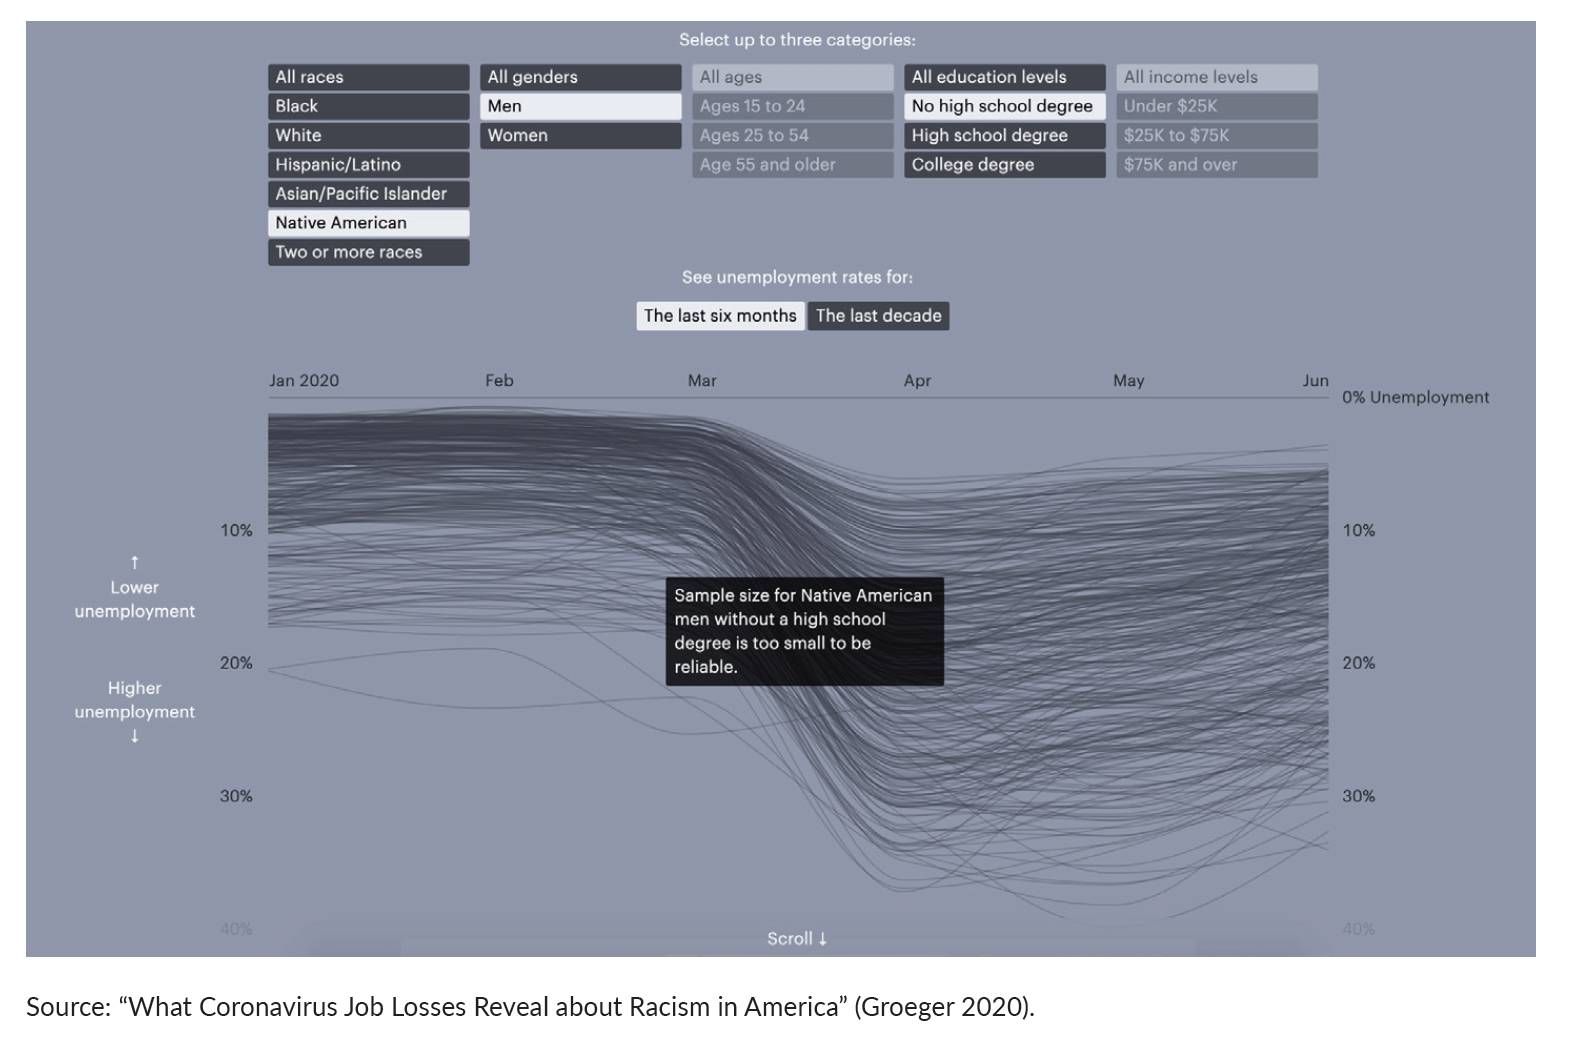
And many charts on race show Black people, Hispanic/Latino people, and white people but not other racial or ethnic groups—oftentimes because of data limitations like small sample sizes or no data at all. In thinking about missing groups, and who is represented, be aware of how critical it is to use inclusive data.
Improve Inclusivity in Your Data
To ensure that your data is as inclusive as possible, lead with empathy and sensitivity toward all people, and follow the guidelines below.
Avoid Lumping Groups
If there’s a small sample size, populations are sometimes lumped together to make analysis more convenient. For instance, a map showing race and ethnicity across the US might include a grouping of “Everyone Else,” without explaining what groups have been excluded. Doing so can have harmful effects on the communities that are lumped together.
Using small sample sizes for groups that are already underrepresented is a choice on the part of the privileged, not limitations inherent in small populations. Practically speaking, however, small sample sizes are sometimes unavoidable owing to time or budget limitations. But you can do better by acknowledging where aggregation may mask variation within certain groups, or when small sample sizes do not enable statistics and science to be conducted objectively and accurately. As a data producer—someone who is designing and issuing surveys—you should also seek to broaden the number of groups collected in your data. Both data researchers and producers should strive to do a better job collecting data that reflects the lives of all people, rather than place the burden on already-marginalized communities.
Include Nonbinary Gender Categories
Sometimes certain populations are left out of data collection altogether. Many major federal surveys, for example, do not offer nonbinary or transgender as response options when asking about gender. This is an opportunity for you to make it clear to your readers what information you have and do not have in your data.

Calling out the absence of nonbinary categories can prompt the next data researcher and communicator to make necessary changes to their future surveys and visualizations. It takes the entire ecosystem of data producers, consumers, and communicators working in tandem to achieve the goals of inclusivity.
Find Alternatives for “Other”
It's important to understand the significance of using inclusive language when segmenting groups. What is the right approach to analyzing and communicating other? And can you use more inclusive language to talk about this group? First, you have to understand what the category is measuring. This may include a wide array of races, ethnicities, religions, other characteristics, and their intersections. While this option is useful for people who do not see themselves in the usual categories, you should question whether grouping people with such varied characteristics and life experiences together is actually meaningful.
Here are six possible alternatives to other:
- Another race
- Additional groups
- All other self-descriptions
- People identifying as other or multiple races
- Identity not listed
- Identity not listed in the survey
Some of these terms are more verbose and may not fit as nicely in a table or under a bar in a bar chart. But they are more inclusive and avoid some issues we’ve already discussed. It’s important to note that these labels may not be the exact options available to respondents in a survey, and “other” was checked because no other choice was available.
If you have that concern, a simple note or footnote can be included to acknowledge the change from the raw data to your presentation of the results. Nonetheless, these alternatives are, in the general sense, still true and accurate, so you can add a separate note or footnote to the graph, table, or text to make the change clear to readers.
If You’re Not Including All Groups, Offer an Explanation
In cases where data was collected about a specific group but that group was not presented in the chart or included in the analysis, be transparent about your methods by noting which groups were included in the original dataset. Alternatively, discrepancies in the data research can be noted without misinforming readers.
Resources
- Interview: How can we do no harm with data?
- Video: Do No Harm Guide
- Video Transcript: Do No Harm Guide
- Website: Tableau Do No Harm
- Document: Urban Institute Consolidated Recommendations
- Book: Data Feminism, by Catherine D’Ignazio and Lauren F. Klein