Generate and Analyze Logs
Learning Objectives
After completing this unit, you’ll be able to:
- View debug logs in the Log Inspector or a text editor.
- Set various log levels for your debug logs.
- Manage and switch perspectives using the Log Inspector.
View Debug Logs
As a good commander, you review the system logs to check that everything is in working order. Logs are one of the best places to identify problems with a system or program. Using the Developer Console, you can look at various debug logs to understand how your code works and to identify any performance issues.
View Logs in the Text Editor
Viewing a debug log is simple. To generate a log, let’s execute the EmailMissionSpecialist Apex class that you created earlier.
You can view your log in two ways.
-
Before execution, enable Open Log in the Enter Apex Code window. The log opens after your code has been executed.
-
After execution, double-click the log that appears in the Logs tab.
Let’s try the first method.
- Select Debug | Open Execute Anonymous Window.
- The Enter Apex Code window displays the last code that you entered for execution. If it’s different from the following code, delete it and paste the following code. Be sure to replace Enter your email addresswith your email address.
EmailMissionSpecialist em = new EmailMissionSpecialist(); em.sendMail('Enter your email address', 'Flight Path Change', 'Mission Control 123: Your flight path has been changed to avoid collision ' + 'with asteroid 2014 QO441.'); - Select the Open Log option.
- Click Execute.
The execution log that you see probably seems like a confusing jumble of numbers and words, so let’s talk about how you can read and understand log data.

Read Your Log Data
Let’s run the EmailMissionSpecialist class again, but this time let’s introduce an error. Then, let’s find the resulting log in the Logs tab.
- Select Debug | Open Execute Anonymous Window. Provide an invalid email address, such as
testingemail.EmailMissionSpecialist em = new EmailMissionSpecialist(); em.sendMail('testingemail', 'Flight Path Change', 'Mission Control 123: Your flight path has been changed to avoid collision ' + 'with asteroid 2014 QO441.'); - Deselect the Open Log option.
- Click Execute.After you run the code, you see a dialog box that includes the error.

- Click OK, and then double-click the new log in the Logs tab. If you’re not sure which log is newest, click the heading for the Time column to sort the logs by the time when they were generated.

You can read a debug log by identifying what each column represents.
-
Timestamp—The time when the event occurred. The timestamp is always in the user’s time zone and in HH:mm:ss:SSS format.
-
Event—The event that triggered the debug log entry. For instance, in the execution log that you generated, the
FATAL_ERRORevent is logged when the email address is determined to be invalid.
-
Details—Details about the line of code and the method name where the code was executed.
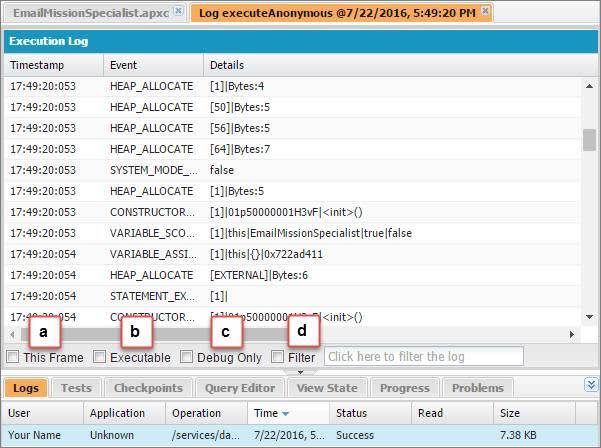
You can change what you see in the Execution Log by selecting This Frame (a), Executable (b), or Debug Only (c). Selecting these options shows you only certain types of events. For instance, Debug Only shows USER_DEBUG events. You can also filter different parts of the log using Filter (d). Enter a method name, or any other text you are specifically looking for, and the log filters your results.
You can also view the debug log as a raw log, which shows you more information. Select File | Open Raw Log. The timestamp in a raw log shows the time elapsed in nanoseconds (in parentheses) since the start of the event.

This combination of the timestamp, event, and details provides valuable insights into how your code works and the errors that occur.
While all this information is great, what if you want to quickly look for certain values in the debug log? After all, you have many other responsibilities as commander. An excellent way to do so is to use the System.debug() method in Apex.
The great thing about System.debug() is that you can add it anywhere in your code to track values, helping you debug your own code.
Here is the syntax for System.debug(). To display a message:
System.debug('Your Message');To display the value of a variable:
System.debug(yourVariable);
To display a labeled value:
System.debug('Your Label: ' + yourVariable);
Use the Log Inspector
The handy Log Inspector exists to make it easier to view large logs! The Log Inspector uses log panel views to provide different perspectives of your code. Check it out by selecting Debug | View Log Panels.

Log panels change the structure of the log, to give other helpful information about the context for the code being executed. For example, different panels show the source, execution times, heap size, and calling hierarchy. (We know, more geek speak—this section is relatively technical. Remember, we’re getting to know the Developer Console, not the finer points of debugging. So if anything doesn’t make sense to you, try not to worry about it too much.)
These log panels interact with each other to help you debug your own code. For instance, when you click a log entry in the Execution Log or Stack Tree, the other panels (Source, Source List, Variables, and Execution Stack) refresh to show related information.

These panels are available in the Log Inspector.
-
Stack Tree—Displays log entries within the hierarchy of their objects and their execution using a top-down tree view. For instance, if one class calls a second class, the second class is shown as the child of the first.
-
Execution Stack—Displays a bottom-up view of the selected item. It displays the log entry, followed by the operation that called it.
-
Execution Log—Displays every action that occurred during the execution of your code.
-
Source—Displays the contents of the source file, indicating the line of code being run when the selected log entry was generated.
-
Source List—Displays the context of the code being executed when the event was logged. For example, if you select the log entry generated when the faulty email address value was entered, the Source List shows execute_anonymous_apex.
-
Variables—Displays the variables and their assigned values that were in scope when the code that generated the selected log entry was run.
-
Execution Overview—Displays statistics for the code being executed, including the execution time and heap size.
What Is the Perspective Manager and How Can You Switch Perspectives?
A perspective is a layout of grouped panels. For instance, the predefined Debug perspective displays the Execution Log, Source, and Variables, while the Analysis perspective displays the Stack Tree, Execution Log, Execution Stack, and Execution Overview.
You can choose a perspective by selecting Debug | Switch Perspectives or Debug | Perspective Manager. Yes, it’s as easy as switching between different communication panels—and much easier than trying to decipher logs from your Mission Specialist, Earth Space Station, and Mars Mission Control all in the same view.
You can also create your own perspective. Configure your preferred combination of panels to display, and then select Debug | Save Perspective As. Enter a name for your perspective, and then click OK.
Manipulate Log Data to Find What You Need
You’re aware that Engine 3 has problems running smoothly at times. Having this engine running at capacity is critical as you steer to avoid asteroid 2014 QO441. But every time you try to run a systems check, you also get information from a depressed robot in your spaceship. It sends garbled reports predicting a robot uprising, increasing the number of lines in your log—and possibly making you miss valuable information.
You need a way to control the amount of information logged. Luckily for you, the Developer Console does just that with the help of log categories and log levels.
Log Categories
A log category is the type of information that is being logged.
Here are two common log categories.
-
ApexCode, which logs events related to Apex code and includes information about the start and end of an Apex method.
-
Database, which includes logs related to database events, including Database Manipulation Language (DML), SOSL, and SOQL queries (something we get into later).
Log Levels and How to Change Them
It seems that Engine 3 is having problems again. As you’re going through the logs to see what could have caused these problems, you see warning messages about the uprising from the melancholy robot.
One robot does not make an uprising, so you’re not too worried about the warnings. The faulty engine, however, is an urgent concern. What if you lose track of the actual messages from Engine 3 buried in all that log data? Log levels to the rescue!
Log levels control how much detail is logged for each log category. The following levels are available in the Developer Console, from the least amount of data logged (level = NONE) to the most (level = FINEST).
NONEERRORWARNINFODEBUGFINEFINERFINEST
Logging levels are cumulative. For instance, if the log level is INFO for an event, log information at the ERROR and WARN levels is also included. But if your log level is ERROR, you get only error messages. You don’t get warning messages or any other log information for that log category.
The information a log level provides also depends on the log event. Different log events start logging at particular log levels. For instance, some ApexCode events start logging at INFO. If you set ERROR as the log level, you don’t get any log information for those events.
To get the information you’re looking for, modify the log levels for different events. You want to suppress logging when the robot saves messages about the supposed uprising to the database. So, set the log level for the Database (DB) category to NONE or ERROR.
You can set these levels by selecting Debug | Change Log Levels.

On the General Trace Settings for You tab, click Add/Change (1). In the Change DebugLevel window, choose the log level for each category. Remember, use log levels judiciously. If your log level is FINEST (2), your code can hit log limits and take longer to run. Don’t worry if you don’t see all the levels when you update the log level for a category. Only the levels that add more logging for the category are listed.
Fortunately, once you’ve disabled logging for the robot’s warnings you find it easy to identify the problem with Engine 3: Its coolant level is low. You dispatch an engineer to add more coolant. While you’re at it, you ask the engineer to oil the robot’s joints. You hope that the fresh lubricant makes the robot a bit happier.
Resources