Follow the Cycle of Visual Analysis
Learning Objectives
After completing this unit, you’ll be able to:
- Explain the cycle of visual analysis.
- Begin a viz even when requirements are unclear.

Before You Start
If you haven’t already, make sure you complete The Tableau Data Model and Metadata Management in Tableau.
In this module, you explore the Great British Bake Off data set you built and cleaned up in these previous modules. Here, you learn if you can find answers to specific questions—and maybe dig up additional questions to explore on your own.
This module is a guided analysis of a specific data set and specific analytical questions, designed to help you learn by doing. Just like in the previous modules, there are lots of asides, questions, and discussion of why and how things happen, not just the series of clicks needed to get a set result. Some of the units have quiz questions about the analysis and some are graded challenges that check the vizzes you build.
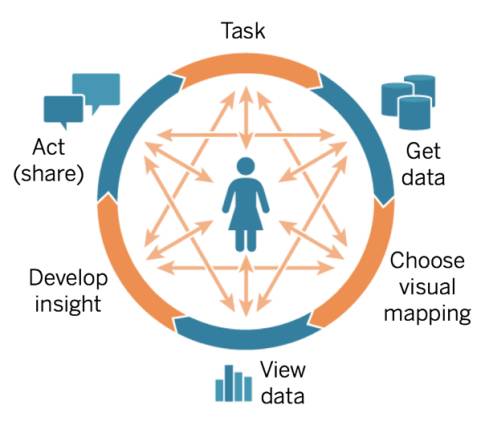
What Is Visual Analysis?
Tableau is all about the cycle of visual analysis.
-
Cycle, because it's not a linear process.
-
Visual, because humans are really good at visual processing.
-
Analysis, because data alone isn't enough—what matters is the meaning, insight, and understanding that can come from data.
Put the Visual in Visual Analysis
Visual analysis needs, well, a visual. Choosing the right chart type for the data and the analysis is an important step in finding and communicating insight. Fortunately for us, Tableau has a built-in set of guidelines to automatically decide what chart type to create based on the fields you’re using.
Remember that no matter how you start, in this module you have the option to reset your viz to the starting state. And in Tableau in general, you can always drag fields around and change things or back up and try again by clearing the sheet or clicking undo.
There are several ways to begin when you don’t know how.
- Select a field or fields in the Data pane and use Show Me to build a viz.
- Double-click a field in the Data pane. Tableau puts that field where it thinks it should go based on the field properties and what else is in the viz.
- Drag a field to a specific part of the authoring environment, such as the Rows shelf or Color. Even if you’re not sure what will happen, give it a whirl!
So should you just go wild, and anything goes? Not quite.
People disagree over the right and wrong way to do analysis all the time, and there aren’t always clear answers. There are certainly best practices, and we never want to mislead with data. (Check out Guidelines to Recognize Misleading Charts or do a web search for “misleading graphs”.)
Tableau supports incredible creativity, but we should always strive to do accurate analysis that is easy to understand and correctly interpret. And when you’re ready to head out on your own, there are many resources on how to build specific chart types, and you can always explore, too. Best of all, you’re now part of a huge community in Tableau Public. Tableau Public has lots of resources, which we link in Resources.
All said and done, it helps to be curious and try to come up with good questions to ask. We offer questions and checks throughout this module to help get you into that practice.