Get Started with Dashboards
Learning Objectives
After completing this unit, you’ll be able to:
- Recognize types of dashboards and when to use them.
- Explain how to filter dashboards to analyze your data.
- Describe the different ways to export dashboards.
What Are Dashboards?
Dashboards provide you with a ready-to-use visualization of your email and journey data. Let’s see how Isabelle, Northern Trail Outfitters’s (NTO) manager of digital marketing, uses dashboards to monitor how her birthday campaign is performing. More importantly, she’s interested in the campaign deliveries and engagement. Intelligence Reports offers predefined dashboards allowing Isabelle to easily visualize her data to gain valuable insights and quickly identify trends.
-
Email Overview: provides you with a high–level overview of your email campaigns, such as the number of emails sent, open rate, and so on.
-
Email Deliveries: provides a detailed visualization of your email delivery data, such as delivery KPIs–including sends, deliveries, bounces, delivery timelines, and in-depth breakdowns by domain, day of week, and audience.
-
Email Engagement: provides a detailed visualization of your email engagement data, such as engagement KPIs, including opens, clicks, unsubscribes, engagement timelines, and in-depth breakdowns by domain, day of week, and audience.
-
Email Performance: provides a detailed visualization of your email performance data, such as email sends data, including open rate, click rate, unsubscribe rate, performance funnel, and in-depth breakdowns by domain, day of week, and audience.
-
Journey Performance by Email: provides an in-depth view into your journey and activities data, including the journey performance and a detailed breakdown by domain, day of week, and audience.
-
Push Deliveries: provides a detailed visualization of your push delivery data, including push notification delivery data and timelines. Get breakdowns by day of the week, mobile OS, and mobile app.
-
Push Engagement: provides details about your push notification engagement key performance indicators (KPIs), including deliveries, opens, and open rates. View breakdowns by day of the week, mobile OS, and mobile apps.
-
Push Performance: provides details about your overall push performance, including push sends, opens, bounces, and deliveries. Get breakdowns by day of the week, mobile OS and mobile app.
-
Journey Performance by Push: provides details about your journey and push notification performance data. View breakdowns by day of the week, mobile OS, and mobile app.
-
In-App Deliveries Dashboard: provides details about your in-app delivery data including unique sends, message deliveries, device displays, and display rate. View breakdowns by day of the week, mobile operating system, and mobile app.
-
In-App Engagement Dashboard: provides details about your in-app engagement key performance indicators (KPIs), including device button clicks, device dismisses, device button click rates, and more. View breakdowns by day of the week, mobile OS, and mobile apps.
-
In-App Performance Dashboard: provides details about your in-app message performance, including an overview of sends, by looking at deliveries, display rate, and dismisses. View breakdowns by day of week, mobile OS, and mobile app.
-
Journey Performance by In-App Dashboard: provides details about your Journey and in-app message performance data. View breakdowns by day of the week, mobile operating system, and mobile app.
-
WhatsApp Deliveries Dashboard: provides details about your WhatsApp delivery data including sends, deliveries, and delivery rates. View breakdowns by day of the week, WhatsApp business account, and WhatsApp channel name.
-
WhatsApp Engagement Dashboard: provides details about your WhatsApp engagement key performance indicators (KPIs), including the number of messages opened and the message open rate. View breakdowns by day of the week, WhatsApp business account, and WhatsApp channel name.
-
WhatsApp Performance Dashboard: provides details about your WhatsApp message performance, including an overview of sends, by looking at deliveries, bounce rate, and open rate. View breakdowns by day of the week, WhatsApp business account, WhatsApp channel name, WhatsApp send name, and locale.
-
Journey Performance by WhatsApp Dashboard: provides details about your journey and WhatsApp message performance data. View breakdowns by day of the week, WhatsApp business account, WhatsApp channel name, Journey name, Journey version, and Journey activity name.
Let’s follow along as Isabelle uses these dashboards to analyze and improve her birthday campaign.
Put Dashboards to Work
Isabelle plans to use two of the predefined dashboards to focus on her campaign’s performance: Email Deliveries and Email Engagement. She starts with the Email Deliveries dashboard.

Isabelle has already filtered her Email Deliveries dashboard (1) to focus on the relevant information by filtering by her business unit (Northern Trail Outfitters) and campaign (Birthday). She sees her delivery KPIs, including Sends, Deliveries, and Bounce Rate and notices that her sends and deliveries have increased while her bounce rate has decreased (2). In the Delivery Timeline (3) she uses the interactive filters to focus her data on a specific measurement, like bounce rate, so she can see trends over time (4).
Isabelle can also take a look at the Email Engagement dashboard to see how her users engaged with an email.
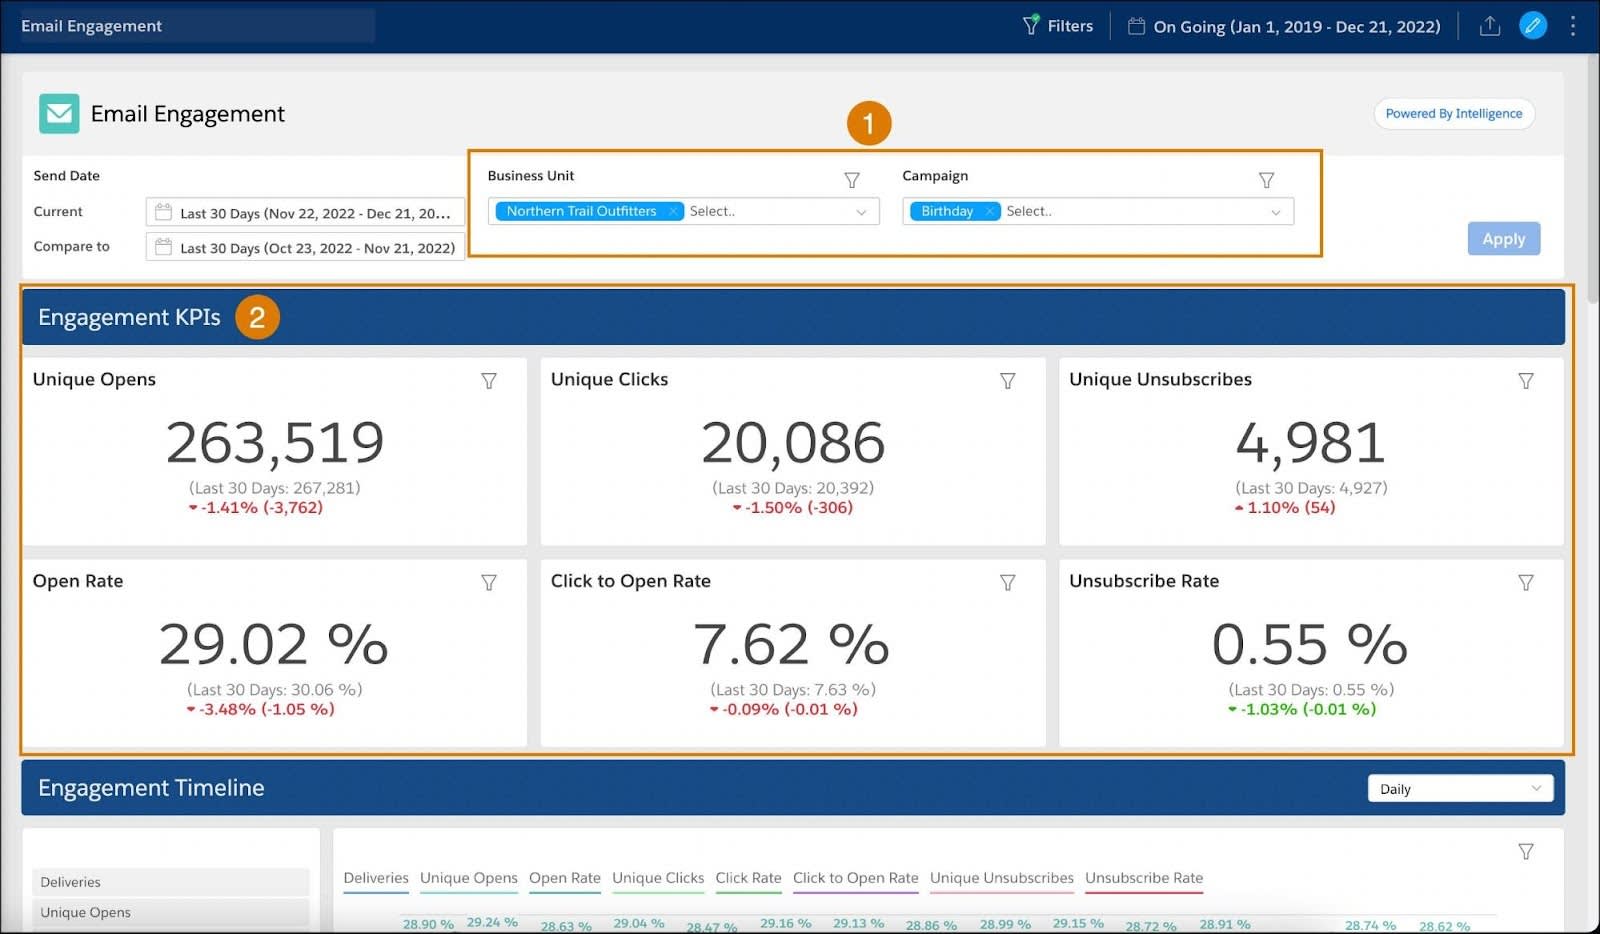
Once she clicks the dashboard, it is automatically filtered for her since filters are saved automatically—even when toggling between different dashboards (1). Here she can focus on the main Engagement KPIs (2), such as Open Rate and Click Rate. She can also scroll down and see which day of the week had the highest open rate, which helps her plan future sends.
Share Your Dashboards
If you want to share a dashboard with others or create a report to be scheduled and delivered, you can use the share option. This allows you to:
-
Share via Slack: This option shares a dashboard page or widget directly to Slack.
-
Share via Email: This option shares a dashboard page or widget via email.
-
Download: This option downloads a local file of a dashboard page or widget, either as a PNG, Excel, PDF or PPT file format.
-
Create Scheduled Report: This option creates a report with the dashboard that can be set to run as part of a workflow, in real-time, or according to a defined schedule. We cover scheduled reports in more detail in the final unit.
Now onto the next unit where you learn how to use pivot tables in Intelligence Reports.