Learn How Forecast Data Is Created
Learning Objectives
After completing this unit, you’ll be able to:
- Describe the different terms and concepts associated with Advanced Account Forecasting.
- Explain the basics of the forecast framework.
- Describe the different terms and concepts associated with the Data Processing Engine.
- Explain how Data Processing Engine works with Advanced Account Forecasting.
The Story at Rayler Parts So Far
Rayler Parts, a manufacturer of construction equipment and heavy machinery, is having a successful run with Agentforce Manufacturing. With advanced account forecasts, the sales and operations team can create flexible and granular forecasts. The business is growing rapidly and account managers are always looking at new requirements to refine their forecast calculations further. Data Processing Engine (DPE) already helps them transform their data and automate the complex calculations that create account forecasts, but they want more.
Rayler Parts sells its products through two distinct business units: Industrial and Consumer. These business units have different forecast requirements. Cindy fulfilled the requirements by creating two forecast sets for the two business units and specifying the unit-specific configurations in each set.
In this module, follow Cindy as she explores the Data Processing Engine tool and learns about its role in forecasting.
Quick Refresher on Advanced Account Forecasting
Cindy’s starting to think more about customizing forecasts and that requires customization of the DPE templates that are used for forecast calculations. But first, she explores the basic concepts of advanced account forecasting.
-
How does the system determine what to display on a forecast grid?
The Advanced Account Forecast Set holds the configurations that determine how your forecast looks.
-
How does the system calculate the forecast values?
The DPE definitions hold the calculation logic to compute the forecast data.
-
Where is the forecast data stored for each period?
The Advanced Account Forecast Fact object holds the forecast data for each period in a separate record. Forecast measures and dimensions are available as fields on this object.
-
Where can you view the forecast data for a particular account?
The Advanced Account Forecast Set Partner records hold the forecast data for each account. These records represent the junction between an advanced account forecast set (a forecast’s configuration) and an account.
While Account Forecasting only aggregates your forecast by period and product, Advanced Account Forecasting groups and aggregates the forecast data by multiple dimensions such as Ship-To Location, Sales Channel, and others.
Moreover, you can create separate forecast sets to define configurations for different groups of accounts, rather than a single configuration for your entire org. A forecast set helps you define all forecast configurations specific to a region, business unit, or any other logical grouping of your choice. The choices you make in a forecast set determine how you view the forecast grid.
It’s important to understand the role of DPE and the value it brings to Advanced Account Forecasting. Next, Cindy discovers how forecasting works and why the DPE is an important tool.
Forecast Framework Basics
Think of an account’s forecast as a table. The rows in the table are the forecast measures that define the outlook of your business performance. These rows are called forecast metrics, such as Opportunity Quantity, Sales Agreement Quantity, and Order Quantity. With a configurable forecast set, you can also add business-specific measures such as the Percentage of Return Orders, Total Discounts, and more. These custom metrics values can then be used to calculate the final Forecasted Quantity and Forecasted Revenue values. The values can also be used to get visibility into other aspects of the business.
The columns in the forecast table are the forecast dimensions. These are the parameters by which you group and aggregate the data. So, if you want to view forecast data grouped by product category and location for each period, those are your forecast dimensions.

As you can imagine, setting up a forecast table can be difficult. So Agentforce Manufacturing provides a predefined table called the Advanced Account Forecast Fact object. Think of it like a recipe for forecasts where the measures and dimensions are readily available as fields. You can use the object as-is, add new fields to it, or remove fields you don't need. Further, if you want to use a custom object, you can use the Advanced Account Forecast Fact object as a reference.
What Is the Data Processing Engine?
So now Cindy knows that the forecast data is housed in the Advanced Account Forecast Fact object. The dimensions and the metrics make up the fields. But how are the values for the metrics calculated? And, how do the values get populated in the Advanced Account Forecast Fact records? That’s where the Data Processing Engine comes in. First, she gets familiar with a few terms.
- A DPE definition is a precise recipe used to transform your data.
- A DPE template is a pre-made transformation recipe. Agentforce Manufacturing provides DPE templates that you can clone to get started.
- A DPE node is an ingredient or step in the recipe. Nodes can define source objects or perform actions on the data.
- A DPE definition runs as a job in your org, primarily via flows, to calculate forecast metric values.
DPE and Advanced Account Forecasting
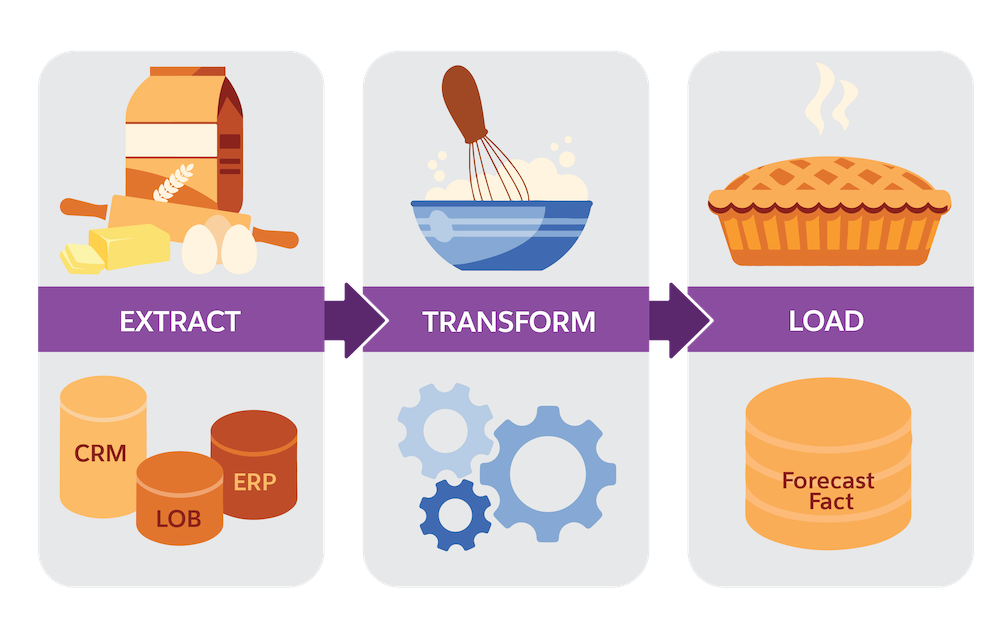
ETL (Extract Transform Load) tool is a data integration process similar to developing a recipe for a cookbook. You take ingredients from disconnected sources, mix and combine the ingredients to transform the taste, and then finalize the recipe by adding it to the book. Similarly, Data Processing Engine takes data in the org, transforms it, and finally writes it back to a specified object. Cindy explores each component of ETL in detail.
-
Extract: Any object from which data is used as an input is defined as a data source node in a DPE definition. The DPE extracts data from specified fields in different objects in the org. For example, Sales Agreements, Orders, Opportunities, Products, and Advanced Account Forecast Facts.
-
Transform: The DPE definition includes action-performing nodes in the form of joins, filters, group and aggregate, formulas, and slices to transform the data from the data source objects. For example, a definition can be set up to retain sales agreements and opportunities which are in an active state, and apply formulas on the calculated quantity and revenue values. The definition can then join nodes to combine fields and values.
-
Load: Finally, the transformed data is written back to the Advanced Account Forecast Fact object (or your custom object) for each period as new or updated records. Remember, all the measures exist as fields on this object. So for each period, the measure values are calculated by the DPE and updated in the forecast table.
OK, that was a lot! But it’s important for Cindy to know the mechanics behind the forecast calculations.
It’s now time for Cindy to explore the DPE tool in greater detail.
Resources
- Salesforce Help: Create Holistic, Multi-Enterprise Forecasts with Advanced Account Forecasting
- Salesforce Website: Agentforce Manufacturing Learning Org