Build a Dashboard
Lesson Objectives
After completing this unit, you'll be able to:
- Explain how dashboards can improve analysis.
- Combine views to build a dashboard.
- Use best practices for dashboard building.
Before You Start
Before you continue with this module, make sure you complete Data Filtering and Sorting in Tableau Desktop. The work you do here builds on the concepts you learn in that module.
You’ve created a few views that communicate important information your manager needs to know. Now you need a way to say, “Hey, here’s the deal. See how we’ve got negative profit in these states? This is one of the reasons why.”
Tableau has a sheet for that: the dashboard! You can use dashboards to display multiple worksheets at once and make them interact with each other as needed. By combining your views into an interactive dashboard, your stakeholders can compare a variety of data simultaneously, gaining deeper insights into the business.
Know the Best Practices for Dashboards
The following dashboard example provides an executive overview of sales by segment and category. It breaks down sales and profit, and offers a convenient map to view regional performance.
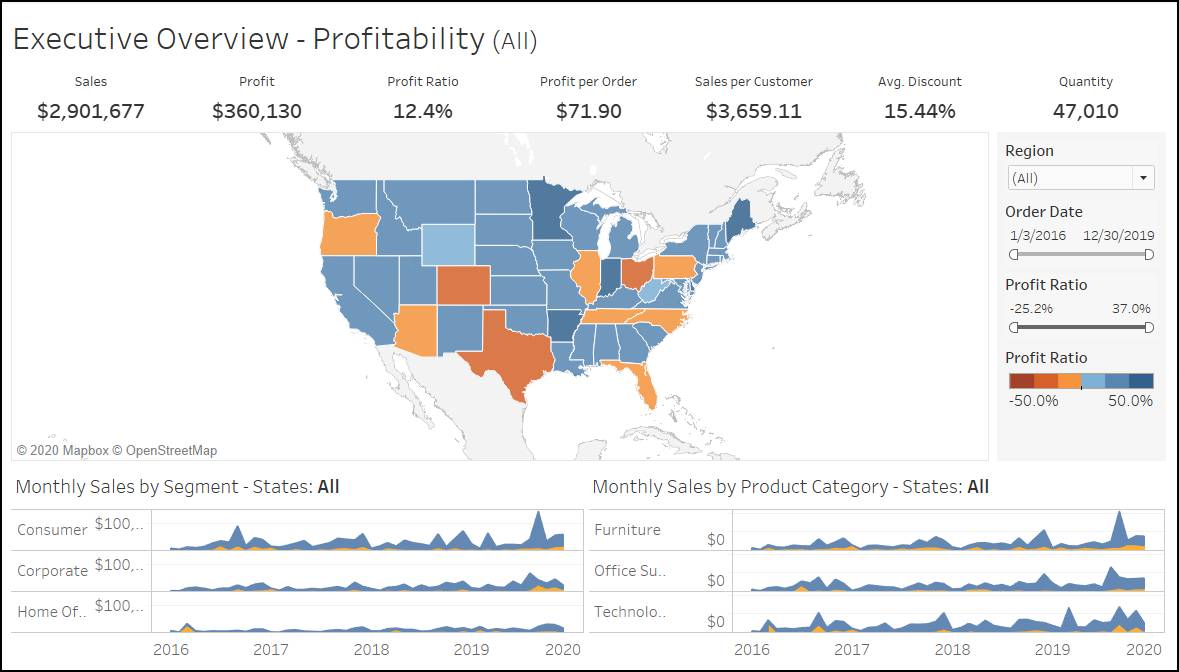
This is a great dashboard. But before you build one like this, there are a few things to keep in mind.
- Know your purpose and audience.
- Be sure to place the most important view in the most prominent spot.
- Construct your visualization at the size it will be viewed, being aware of devices that might be used to view it.
- Limit the number of views to avoid crowding and clutter.
Create a Dashboard
Now that you have seen an example of what a dashboard looks like, you’re ready to set up your dashboard. Let’s get started.
If you’ve completed other Tableau modules in Trailhead, there’s a good chance you’re already familiar with the Trailhead Simulator.
For the best experience, view the Trailhead Simulator on a computer, not a mobile device. Trailhead Simulator is different from a Trailhead Playground. The simulator doesn’t store your progress or any data you enter. If you close your browser, you start from the beginning of the simulation again. You can always use the navigation controls at the bottom of the simulator to get back to where you left off.

Navigation Controls |
Description |
|---|---|
(1) Left Arrow |
Go backward in the simulator. |
(2) Right Arrow |
Go forward in the simulator. |
(3) Scrub Bar |
View your progress, plus you can use the progress arrow to quickly move to a different location within the simulator. |
(4) Close Button |
Exit the simulator. Remember that if you close the simulator, you start from the beginning the next time you launch it. |
When you click in the wrong spot, highlighting shows you where to click.

Now you’re ready to practice what you’ve learned and build some views in Tableau.
Combine Views in a Dashboard
You want to emphasize that certain items sold in certain places are doing poorly. Previously, you built a bar chart and a map view that demonstrate this point nicely—now if only they can be put together.
- Launch the Trailhead Simulator.
- Click Combine Views in a Dashboard.
- Click Begin.
- Click the New dashboard icon.

- Notice the size of the dashboard. You want a larger area to combine your views. In the Dashboard pane at the left, click the Size dropdown.
- Next, click the Fixed size dropdown.
- Select Automatic so the dashboard will resize to fit any screen.
- Drag Sales in the South into your dashboard.
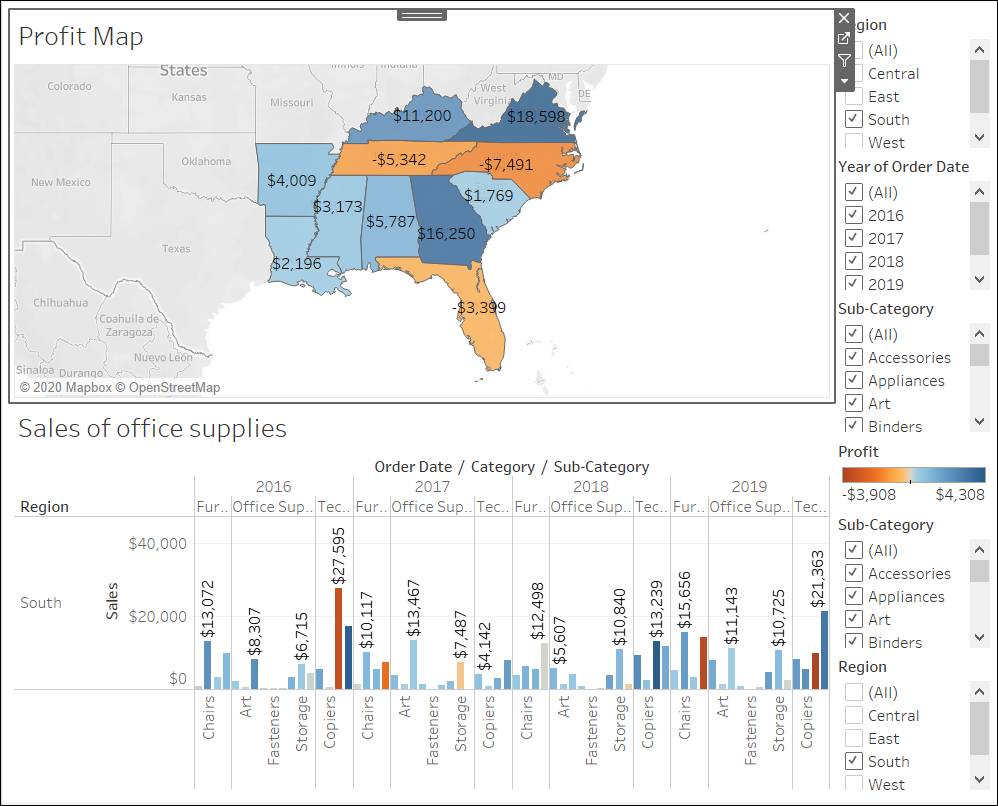
- Now drag Profit Map into your dashboard and place it above Sales in the South.
- While there’s some more work to do to get your dashboard the way you want it, it’s already looking good. You can see both views at once!
- Click Next Exercise to continue to the next exercise.
Arrange Your Dashboard
It's not easy to see details in this dashboard. And because we already have the map in the dashboard, we probably don’t need some sections in the bar chart that indicate region.
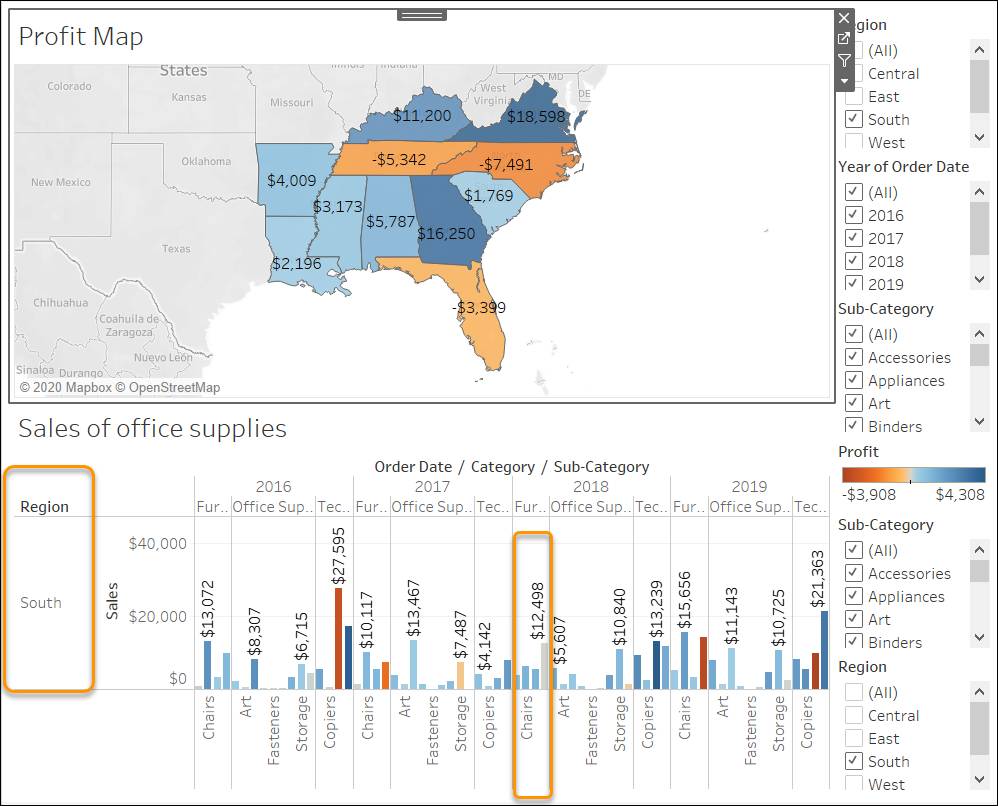
Resolving these issues gives you more room to communicate the information you need.
- You should already be in Arrange Your Dashboard. If not, launch the Trailhead Simulator and click Arrange Your Dashboard.
- Click Begin.
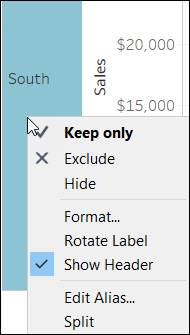
- On the Sales in the South bar chart, right-click (PC) or control-click (Mac) in the column area under Region, and then deselect Show Header.
- Repeat this process to remove the Category row header. You’ve now hidden unnecessary columns and rows from your dashboard while preserving the breakdown of your data. While you’re at it, clean up the map.
- Right-click the Profit Map title and select Hide Title.
- Repeat this step and hide the Sales in the South view title.
- Then, select the first Sub-Category filter card on the right side of your view, and click the Remove icon
 .
.
- Repeat this step to remove the Region filter card.
- Next remove the second Sub-Category filter card.
- Now you are left with two items, Profit and Year of Order Date. Click the Profit color legend and drag it to below Sales in the South.
- You want to reposition the Year of Order Date filter closer to the map. Right-click (PC) or control-click (Mac) Year of Order Date at the top of the filter and then select Floating.
- You have made this filter a floating box, which means that you can place it anywhere. Click anywhere to continue. We have moved the Year of Order Date filter to just next to the Profit map view. Uncheck 2018 and 2017. Your data is quickly filtered to show that state performance varies year by year. That’s nice, but it can be made even easier to compare.
- Click the dropdown arrow at the top of the Year of Order Date filter, and select Single Value (Slider).
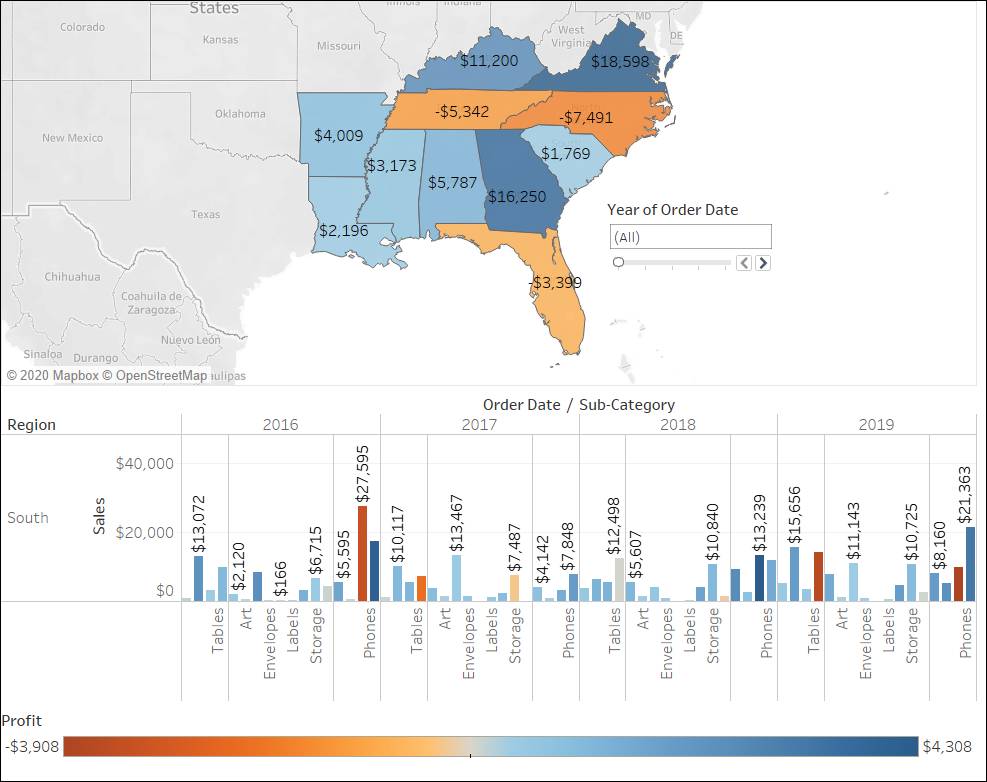 That’s more like it! Now, you can easily compare profit and sales by year.
- Click Home to restart the activity or Exit to continue.
Congratulations! You just created a dashboard and rearranged and deleted components to reduce clutter and improve readability. Now you can compare regional sales on the map with details about what was ordered.
In the next unit, you learn how to add even more interactivity to make your dashboards more interesting and engaging.
Resources
- Tableau Help: Best Practices for Effective Dashboards
- Tableau: 7 tips and tricks from the dashboard experts
- Tableau: 10 Best Practices for Building Effective Dashboards (whitepaper)
- Tableau: Building a Dashboard (video)