Explore Report Data
Learning Objectives
After completing this unit, you’ll be able to:
- Filter and sort data in custom table reports.
- Create row groups.
- Turn on Pivot Mode to view aggregated data.
- Explain the Preview Data mode.
- Export a custom table report.
View Data in Different Ways
Now that the correct data is in your custom table report and the columns are sorted in an order that makes sense, it’s time to analyze your data. Fortunately, there are many built-in tools to do that.
The simplest way to view your data is by sorting each column. Click a column header to sort the data in ascending or descending order.
For more advanced options, click  on a column header. A menu opens that helps you pin the column, auto-size the column, group records by the selected column, and filter the column in various ways.
Another way to view data is by using the Columns and Filters menus on the report. Clicking either Columns or Filters displays a panel with additional functionality to further organize and customize the report.

The Columns menu gives you the option to reorder the columns. You can also deselect columns to hide them. The Row Groups option in the Columns menu groups records by the selected columns. Pivot Mode aggregates numerical column data.
You explore all of these options in-depth in this unit, plus you learn about the Preview Data mode and how to export data.
Create Row Groups
Row Groups give you a way to arrange your data into nested rows. You can group records by any column in the report. The report then automatically aggregates the numerical data for each grouping.
Here’s how you create a row group.
- On a custom table report, click Columns.
- Drag columns to the Row Groups area in the order you want them to be grouped, with the highest-level group first.

- Click Run & Save.
For example, this screenshot shows a custom table report for a multiyear commission payout rule. The report groups rows first by Payout Rule, then by Rep.

If you place Rep before Payout Rule in Row Groups, the report groups records first by Rep, then by Payout Rule.

After you group records by columns, click  next to each group to examine the corresponding records. In the Payout Rule and Rep row group example, the Commission Amount column is broken down by total commission for each rep and by rule. If you expand the Payout Rule group, you can see commission for a rep by each obligation with the payout rule.
Turn On Pivot Mode
Turning on Pivot Mode removes all columns that don’t contain numerical data, then aggregates the numerical data.
In the multiyear commission payout example, enabling Pivot Mode hides the Record and Obligation ID because that data isn’t numerical. The report shows a column for the sum of Commission Amounts.
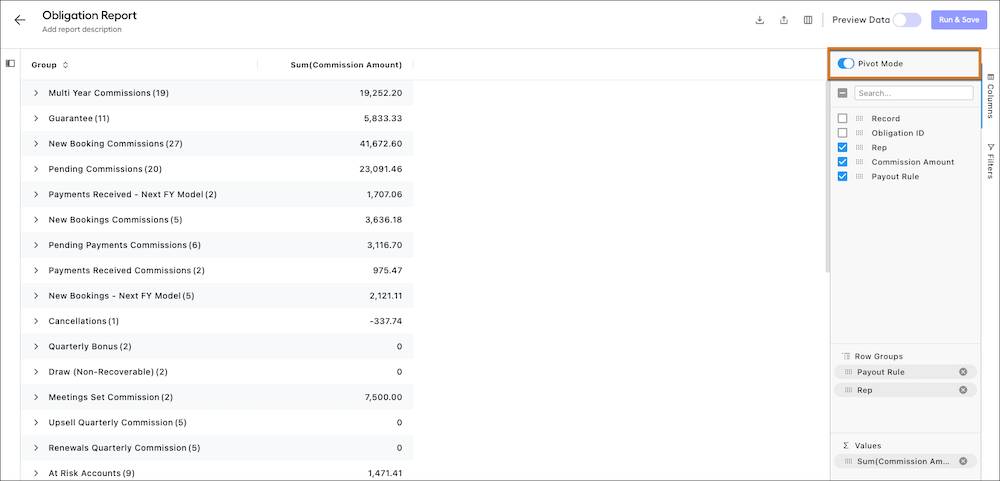
Notice the pivot table preserves existing groupings in the report. The Payout Rule and Rep row groupings aren’t removed.
Turn On Preview Data Mode
Sometimes, there’s a lag in how quickly reports load and react. Custom table reports can contain so much data that it can slow down your interaction with the report. These delays are especially likely with Obligation reports.
If you find a report is loading slowly, turn on Preview Data in the custom table report menu, then click Run & Save.
In preview mode, only the first 1,000 rows are displayed in your browser, but exports include all rows. Loading less data in your browser helps the report run faster.
A message appears on the page telling you that Preview Mode is turned on. It stays on until you turn it off. In the meantime, you can edit your filters and fields without delays.
Export a Report
After you customize your report, exporting it is simple. Click  in the report menu. You receive a notification that the download is being processed. After the download is complete, you can save the report on your computer.
Exit the report and go to the Exports tab in the Reports section. Here, you can find the status of each of your exports and download them again at any time.
To change your report, go back to the Custom Reports tab. From there, you can duplicate or delete a report, but avoid deleting reports in case you want to refer to them later.
In this badge, you learned about the types of custom table reports in Spiff. You also learned how to filter data, add and remove columns, group rows, and more. With these tools, you can find the data you need, export it, and analyze it to make better management decisions for your commission plans and sales teams.
What custom table report will you build first?