Get Started with CRM Analytics
Learning Objectives
After completing this unit, you’ll be able to:
- Describe how CRM Analytics helps government agencies.
- Explain the purpose of dashboards in the Analytics for Licenses, Permits, and Inspections app.
- Explain the purpose of dashboards in the Caseworker Productivity app.
Before You Start
Before you start this module, consider completing the following recommended content.
Data-Driven Insights in the Public Sector
Governments of all sizes are saying goodbye to legacy systems and disconnected data and adopting digital platforms and tools. In this new era of government efficiency, Public Sector Solutions is leading the way with apps designed to streamline common public services, such as licensing and permitting, management of social programs and benefits, and much more. Agency employees are enjoying smaller backlogs, quicker turnaround times, and a single source of truth for all their important work. Constituents are receiving the support and resources they need faster than ever before. In short, life is good.
Along with increased efficiency and fewer roadblocks, a single source for agency data has another, distinct advantage. Government leaders can use this unified data to get a bird’s eye view of what’s working within their department or agency, and areas for improvement.

With less intuitive systems, agency leaders and program managers struggle to make use of operational data. Often, information is difficult to access, out of date, or unreliable because of a lack of standards. Other times, leaders have all the data they need but don’t know how to use it. These roadblocks hinder their ability to make informed decisions about agency operations and to enact positive changes in the organization.
Public Sector CRM Analytics Apps
This is where CRM Analytics for Public Sector Solutions comes into play. CRM Analytics improves visibility into important operational data with prebuilt dashboards and templates. With these analytical tools, you gain a valuable understanding of the underlying data in your org and use predictive analytics based on industry standards to guide your decisions.
The CRM Analytics apps work alongside the other Public Sector Solutions apps in your org so you can capture and visualize trends, monitor workloads, and gain a better perspective of your operations. Each app includes a set of templates and dashboards with easy-to-understand charts and explanations. Think of each dashboard as a prism. Just as a prism disperses light into a spectrum of colors, CRM Analytics dashboards break down data into a spectrum of actionable insights.
Let’s take a closer look at each CRM Analytics App for Public Sector Solutions.
Analytics for Licenses, Permits, and Inspections
Compliance and enforcement officers play a critical role in maintaining the safety and well-being of the community. Every day, officers sort through reviews, violations, complaints, and other reports to assess compliance. They issue, cancel, suspend, or revoke licenses based on their findings. The Analytics for Licenses, Permits, and Inspections app centralizes license, permit, and inspection information and empowers leaders with actionable insights to improve efficiency in these areas.
The app includes four dashboards: Executive Summary, Department Summary, Compliance Insights, and Account Insights. Here’s an overview of each dashboard.
Executive Summary
The Executive Summary dashboard monitors your agency’s performance and constituent satisfaction and presents the insights with data visualizations.

Use the Executive Summary dashboard to:
- Analyze applications, licenses, and fees by type, source, and regulatory authority.
- Compare trends for applications, licenses, fees, inspections, and complaints over time.
- Discover how your agency is performing based on inspections, violations, and complaints.
- See the top five accounts based on licenses issued.
Department Summary
The Department Summary dashboard monitors your department’s performance and identifies applications and inspections that need attention.

Use the Department Summary dashboard to:
- Compare department performance compared to a previous period.
- See the total number of licenses issued by regulatory authorities.
- Review application counts by type and status.
- Discover which applications and inspections need attention.
- View inspection counts by status and number of violations per inspection.
Compliance Insights
The Compliance Insights dashboard tracks your agency’s performance and provides perspective on the impact of inspections and enforcement actions on violations.

Use the Compliance Insights dashboard to:
- Review team performance in completing inspections.
- Analyze inspections by priority, status, and source.
- Compare the number of inspections and resulting violations over time.
- Assess the effectiveness of inspections, violations, complaints, and enforcement actions.
Account Insights
The Account Insights dashboard shows the status of applications, licenses, complaints, inspections, and violations associated with an account.
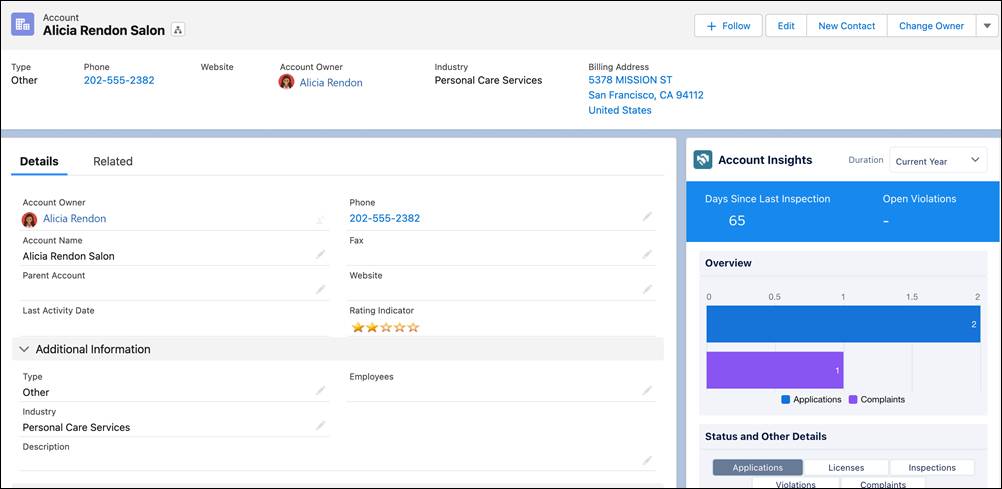
Use the Account Insights dashboard to:
- Review the number of violations for each account.
- View the duration of open violations.
- See the status of applications, licenses, visits, violations, and complaints.
- Drill down into details to explore issues and determine the best next steps.

Caseworker Productivity
Caseworkers make a profound impact on the community. Every day, caseworkers process benefit applications, field public complaints, and manage cases and care plans. The Caseworker Productivity app helps you to better balance the workloads of caseworkers. How? It measures the impact of the social assistance programs your agency provides, tracks case processing efficiency, and gives you high-level information. Track the quantity of benefit disbursements to better manage funding and allocate resources to the most impactful programs. You can access these dashboards from the Benefit Management or Investigative Case Management apps.
The Caseworker Productivity app includes these two dashboards.
Workload Management Analytics
The Workload Management Analytics dashboard enables you to prioritize and distribute cases with confidence—balance workloads, increase productivity, and improve community impact.

Use the Workload Management Analytics dashboard to:
- See a summary of caseloads, case trends, and case distribution.
- Check whether or not you’re meeting service level agreements (SLAs).
- See the community impact of the benefits your agency manages.
- View a leaderboard that ranks caseworkers by their performance.
Case Analytics
The Case Analytics dashboard helps you to track the efficiency with which caseworkers process their assigned cases and fulfill SLAs.
Use the Case Analytics dashboard to:
- See how long a case has been in a particular status.
- Check case processing times.
CRM Analytics apps help you to recognize important trends and areas for improvement so you can make the right adjustments to maximize efficiency, reduce cost, and better serve the community. In the next unit, you learn how to set up these CRM apps in your Public Sector Solutions org.
Resources
- Salesforce Help: CRM Analytics for Public Sector Solutions
- Salesforce Help: Set Up Analytics for Public Sector Solutions
- Trailhead: Explore License and Permit Management for the Public Sector
- Trailhead: Social Program Management Data Model in Public Sector Solutions