Evaluate Your Performance
Learning Objectives
After completing this unit, you’ll be able to:
- Analyze the Overview tab on the My Targets dashboard.
- Analyze tabs Accounts and Products.
Get the Big Picture
Elliott opens the first CRM Analytics dashboard for sales targets from Analytics Studio, My Targets (Targets and Forecasts), to start his analysis. The dashboard comes in two flavors depending on whether or not Account Forecasting is enabled in your org. If Account Forecasting isn’t enabled, the dashboard doesn’t show data such as forecasted revenue numbers derived from account forecasts. Luckily, Rayler Parts already uses Account Forecasting so the dashboard is rich in data!
Elliott notices that the dashboard comes with a few handy filters such as Target, Target Period, and Fiscal Year. These help him view data at any level of detail as he wants to!
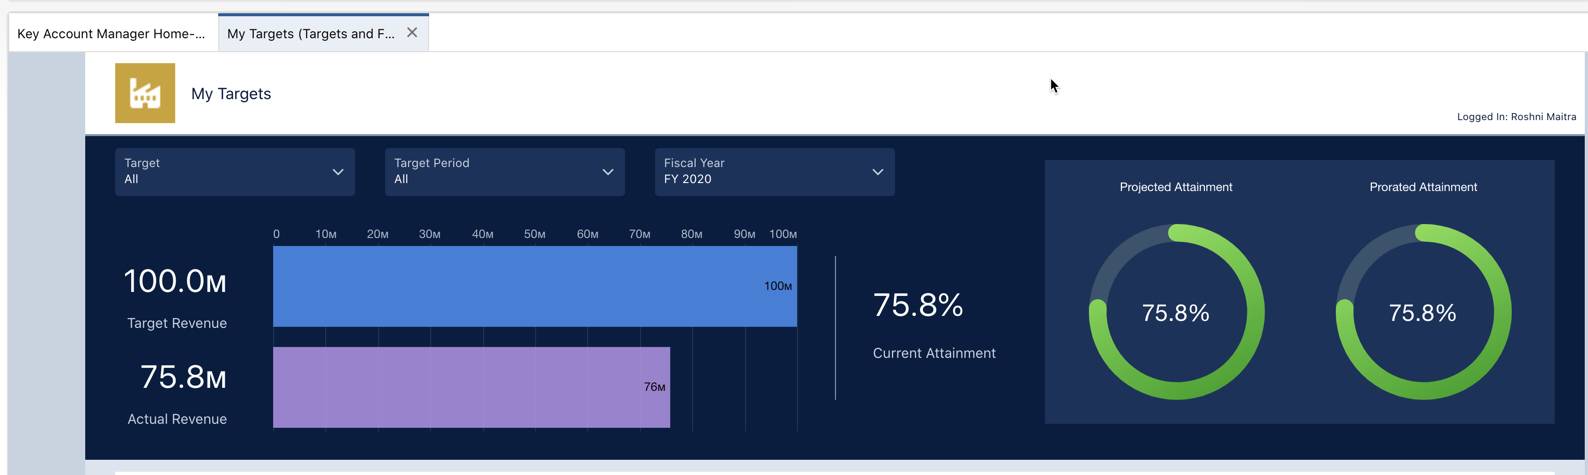
Elliott selects the current fiscal year and can see four key metrics that provide a high-level summary.
- Target Revenue: The total revenue that Elliott has set for himself and his team.
- Actual Revenue: The amount of revenue recorded till the current date by the team.
- Current Attainment: The rate of attaining targets, derived by dividing the actual revenue by the total revenue.
- Projected Attainment: The projected target attainment based on historical data and forecast trends.
- Prorated Attainment: The prorated attainment distributes the current attainment across all periods of the current fiscal year and shows Elliott the percentage of targets his team has completed.
Elliott notes these numbers down and continues with his analysis. Next up, he can see that there’s an Overview tab that shows a direct comparison between the cumulative target revenue and the cumulative actual revenue for each month in a fiscal year. It also shows the line graph for target attainment, which indicates which months fared better in terms of the actual revenue being closer to the target revenue. Elliott can also compare the actual revenue with the forecasted revenue.

Elliott wants to explore the Overview tab further to see what more insights he can gather.
Forecasts and Actuals
Elliott sees that he can switch on two additional toggles to analyze the data. He turns on Projections and Previous Year Targets.
- With time-series driven Projections, you can look at the potential actual revenue for upcoming periods.
- With Previous Year Targets, you can compare the target revenue for each period in the previous year with that of the current year.
Elliott notes an issue with target setting. The target distribution for the previous year is almost identical to this year’s distribution. The difference between actual and target revenue was high last year as well, which means they should have lowered the targets for the current year. The projected revenue is again not quite encouraging for the second half of the year.
One key takeaway for Elliott is that the forecasted revenue for each month is actually closer to the target revenue than the actual revenue. So the team should not only reconsider their targets for next year, but also look at how to generate more accurate forecasts.

There’s also a Month over Month view that shows the target, actual, and forecasted revenue for each month. The target attainment line graph shows that March was the best month in terms of target performance because the attainment was close to the target. For other months, the attainment has fallen short.

Elliott now shifts his focus to the other data points on the Overview tab.
A Few More Highlights
Elliott sees a section on the Overview tab, Year-Over-Year Targets, which shows him critical data for this year, the previous year, and the year before. The number of accounts have increased from last year, which is a good sign. The actuals are a lot lower than last year, but that’s expected because we’re in the middle of the year. The forecasted revenue has gone down this year but is close to the actuals, which is a good sign. The most important insight is that the target revenue for this year is quite high and not close to the forecasted revenue.
That’s not all: The dashboard also shows a few helpful Highlights.
First, Elliott can see a list of new account and product combinations for which targets have been prepared this year. This means that when account managers distributed the targets to their subordinates, they split it by account, by product, or both. For a few account-product combinations, the target attainment percentage is favorable, while for other combinations, the account managers must focus on increasing the sales this quarter.
Next, a panel shows account-product combinations that have a higher target than the previous year, and there’s a 30% increase in yearly targets. For example, if the Acme account had a target of $3,000 last year, a 30% increase brings up the target to $3,900 for this year. Elliott must have account managers concentrate on reaching the targets for these accounts and products to achieve a higher attainment rate. Since there weren’t any targets set two years ago, the results are inconclusive on this panel.

Focus on Accounts and Products
Accounts and products are major contributors towards the revenue for Rayler Parts. Elliott must find out how much they’re contributing to the actual revenue, where they are falling short of meeting targets, and how the attainment rates can be improved. Elliott starts with the Accounts tab.
The Accounts tab has two views, one for the current target year and another for the previous year. Since the company had no goal-setting exercise last year, Elliott focuses on the current year.
The tab has three distinct sections. The first section shows Elliott how each account is performing in his territory. He can analyze the target revenue, actual revenue, target attainment, and the projected revenue to identify which accounts are doing better. He sees that for Omega Incorporated, the actual revenue is $7.1 million, which is more than the target revenue of $6 million. And the projected revenue is also over $7 million, which means that the business is doing better than expected! But for some accounts, both the actual revenue and the projected revenue are low, and so the target attainment is less than 40%. Elliott must discuss with his account managers how they can increase the revenue for such accounts.

The second section shows Elliott the trend of revenue and attainment both across time and across territory. Again, Elliott can either view the cumulative revenue or the target period revenue for this year.

In the third section, Elliott can see the composition of the revenue share for accounts based on products. A heat map shows how each product has contributed to the revenue share of accounts over time. Compactor 9500 has done really well each month so it’s a good idea to sell more of the product to underperforming accounts.
Another heat map shows Elliott the states in the AMER region with the best revenue share and target attainment rates. He now knows which regions to focus on for the next few months.

Having studied accounts, Elliott moves to the Products tab. He can see the targets, actuals, targets attained, and projected values for both revenue and quantity to understand which products are doing better.

Elliott can also see the trend of revenue and attainment across both time and territory for each product. And he can filter the data by product family and product name.
There’s More
Elliott has successfully gathered data to answer the following questions from Bill.
- How’s the overall target compliance, and what’s the projected compliance by the end of the fiscal year?
- How’s the team performing against account forecasts, and how does the actual revenue compare with forecasted revenue?
Elliott now wants to understand how each member in his team is doing with respect to target compliance. Appraisals are around the corner and Elliott must find out which account managers in his team are performing well and which need help.