Use Configurator to Review Data
Learning Objectives
After completing this unit, you’ll be able to:
- List two tools available in Configurator.
- Explain how to use the Commerce Insights tool.
- List two benefits of using Commerce Insights.
Personalize Shopping with Configurator
After you install Einstein on your storefront, you can start taking advantage of the benefits that Einstein has to offer.
Merchandisers can now use Configurator to review your storefront’s data and make it work for the storefront.
What Is Configurator, Exactly?
Configurator is the online tool that you use to build your Einstein Product Recommenders. Einstein Configurator helps merchandisers configure and manage the following features.
-
Commerce Insights: Discover which products are most often purchased together.
-
Einstein Product Recommendations: Predict the most relevant products to promote to shoppers based on recommendation specifications.
In this unit, you learn about commerce insights. You can learn about product recommendations in another module.
Before a merchandiser can use Configurator, an administrator needs to install it. You can find those directions in the Infocenter.
Commerce Insights
Einstein Commerce Insights captures a shopper’s order and product data and identifies products that shoppers purchase together. The Configurator dashboard helps merchandisers discover which other products are most often purchased with a specific product. A merchandiser can drill down into products based on a date range and explore metrics such as product-specific sales and top co-purchase categories. This takes the guesswork out of merchandising, sso your storefront shows shoppers the best products and deals every time.
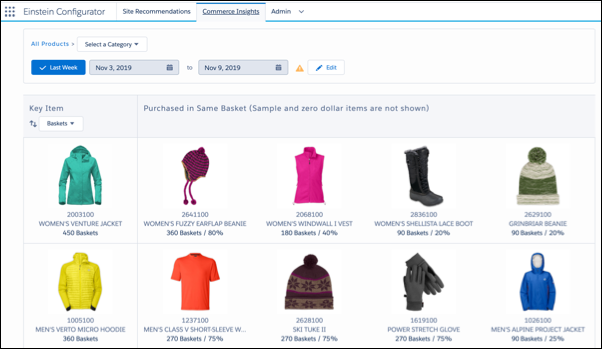
Review a Product
Each row in Commerce Insights shows a single product and the top 50 products purchased in the same basket. Here’s how you review a product.
- Open Configurator.
- On the dashboard, select a product.
- Use Product Drilldown to see details about the baskets in which the product was purchased.
- View the Commonly Bought With table.
Here is the type of data you see.
Data |
Details |
|---|---|
Key Item |
|
Purchased in Same Basket |
|
Configure a Report
An Insight report uses the catalog hierarchy structure that you defined in Business Manager. The category/subcategory navigation lets you focus the report on a particular subset of products. You can also navigate using the breadcrumb trail at the top of the report. Click a level to return the report to that category.
Here’s an example of a report.
By default, the report loads the previous week’s data (defined as Sunday to Saturday of the previous calendar week). You can select a different date range and sort the report in ascending order by baskets, sales, units, or other options. You can go back 30 days and note the data that can't be exported.
Note: A basket is the Agentforce Commerce for B2C term for a cart.
The report also provides a few other characteristics of the baskets that contain the purchased item.
Table |
Description |
|---|---|
Commonly Purchased With |
How many products by category that shopper purchased with the item over the selected time range. |
Basket size |
The frequency with which shoppers purchased the product in a basket of a certain size. |
For example, 60% of the time shoppers purchase the women’s Venture Jacket in a basket with two additional items, for a total basket size of three.
Here’s how to create a report.
- Open Configurator.
- On the Commerce Insights page, select a category.
- Select a date range. The default is the previous week’s data from Sunday to Saturday. If data is missing, the orange icon provides details.
- Select a metric to sort the data.
-
Baskets: Collection of all online purchases submitted by a uniquely identified shopper within a calendar day (12:00 AM ET to 11:59 PM ET).
-
Sales: Online sales amount, excluding shipping and taxes, in the site’s default locale currency. This doesn’t include returned items or products purchased through other channels.
-
Units: Net sales units aggregated by product.
Plan with Commerce Insights
Merchandisers use data to uncover key product purchase correlations, such as seasonal buying trends. This helps them configure product sets that he hasn’t even thought of.
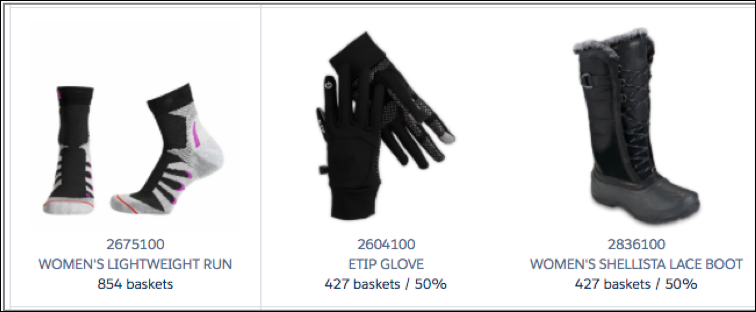
Commerce Insights shows that a winter hat is often purchased with a winter coat or vest.

Commerce Insights also shows that winter socks are often purchased with gloves and winter boots.
Commerce Insights is an analysis tool and not a financial reporting tool. Its data comes from storefront product and order data. It maps key product purchase correlations to discern which products should be grouped together for product bundles, deals, and “complete the look” suggestions.
Wrap It Up
In this unit you learned how to install Configurator. You also learned how merchandisers can use Configurator to review storefront data such as metrics and scenarios with Commerce Insights.