Calculate Procurement-Related Emissions
Learning Objectives
After completing this unit, you’ll be able to:
- List the key records in Agentforce Net Zero that help calculate procurement-related emissions.
- Explain how procurement emissions are calculated.
- List the key fields on a Scope 3 Carbon Footprint record.
Models for Estimation

It can be difficult or impossible to obtain scope 3 information from all individual companies that comprise NTO’s value chain. So Sam turns to an estimation method that helps fill in the gaps when data from suppliers and business partners isn’t available.
Agentforce Net Zero uses emissions factors datasets from econometric analyses. These are called EEIO (Environmentally-Extended Input-Output) models and help Sam estimate tCO₂e per monetary output in an economy across eight upstream, and one downstream GHG scope 3 category. The models assign a carbon emissions intensity value to each economic sector, with the unit of the numeric value being tCO₂e per unit of currency. The GHG categories can be matched to spending categories in NTO’s procurement data. Make sure you check out the calculation shown at the end of this unit to understand this better.
Agentforce Net Zero comes with a predefined United States Environmentally-Extended Input-Output (USEEIO) dataset that uses USD as the currency. The USEEIO dataset provides emissions factors in units of tCO₂e per millions of dollars. Northern Trail Outfitters can either use that dataset as reference data or they can import a different EEIO emissions factor dataset, such as Economic Input-Output Life Cycle Assessment (EIO-LCA), Multi-Regional Input Output (MRIO), or the European Union government’s EEIO models.
The EEIO data that comes with Agentforce Net Zero is already pre-matched to various GHG Protocol Scope 3 categories. NTO can use the Scope 3 Hub setup assistant in Agentforce Net Zero to manage this dataset, import a different dataset, or to manually override the categories that are matched to each economic activity.

With the Scope 3 Hub in Agentforce Net Zero, each line in a procurement dataset for NTO can be matched to an EEIO emission factor and a GHG Scope 3 category. Check out Manage Scope 3 Value Chain Data for more details.
A Tale of Records
While Sam would generally use Scope 3 Hub to do a complete EEIO analysis, he can also create his own records in Agentforce Net Zero that apply EEIO emissions factors to procurement records. Let's go over some key records in Agentforce Net Zero that help us calculate procurement-related emissions.
A Procurement Summary record represents a rolled up (summarized) group of Procurement Item records, each of which quantify and classify spending for a specific GHG category.
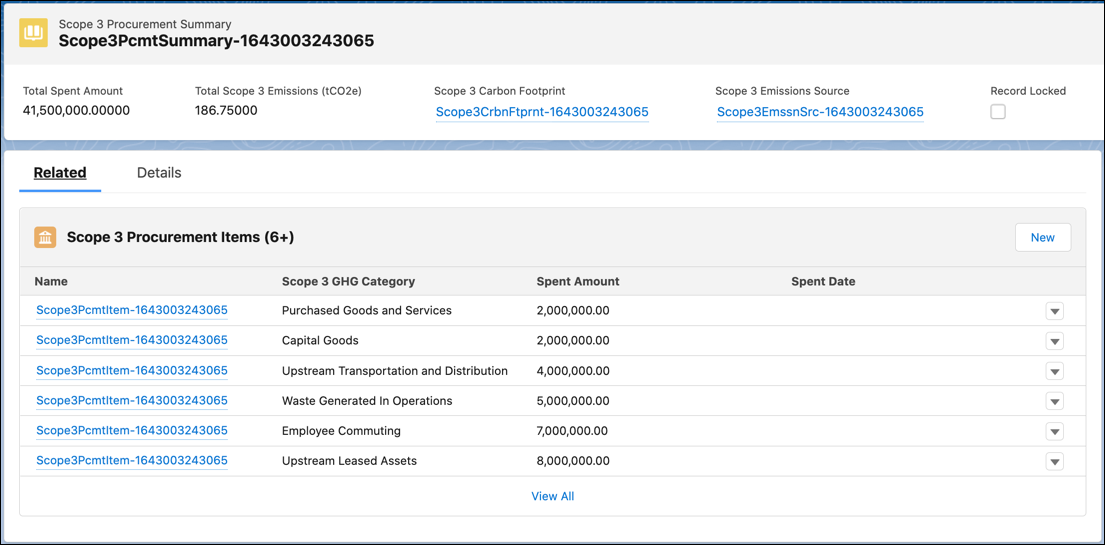
A Procurement Item record specifies the spending details for a single category. Sam can specify the spent amount, and whether a particular procurement matches spending category 1, 2, or 3. Sam can then associate the correct GHG scope 3 category for this procurement item. Category examples include Capital Goods, Waste Generated in Operations, Purchased Goods and Services, and more. Sam can also apply vendor-specific emissions to override the total scope 3 emissions.

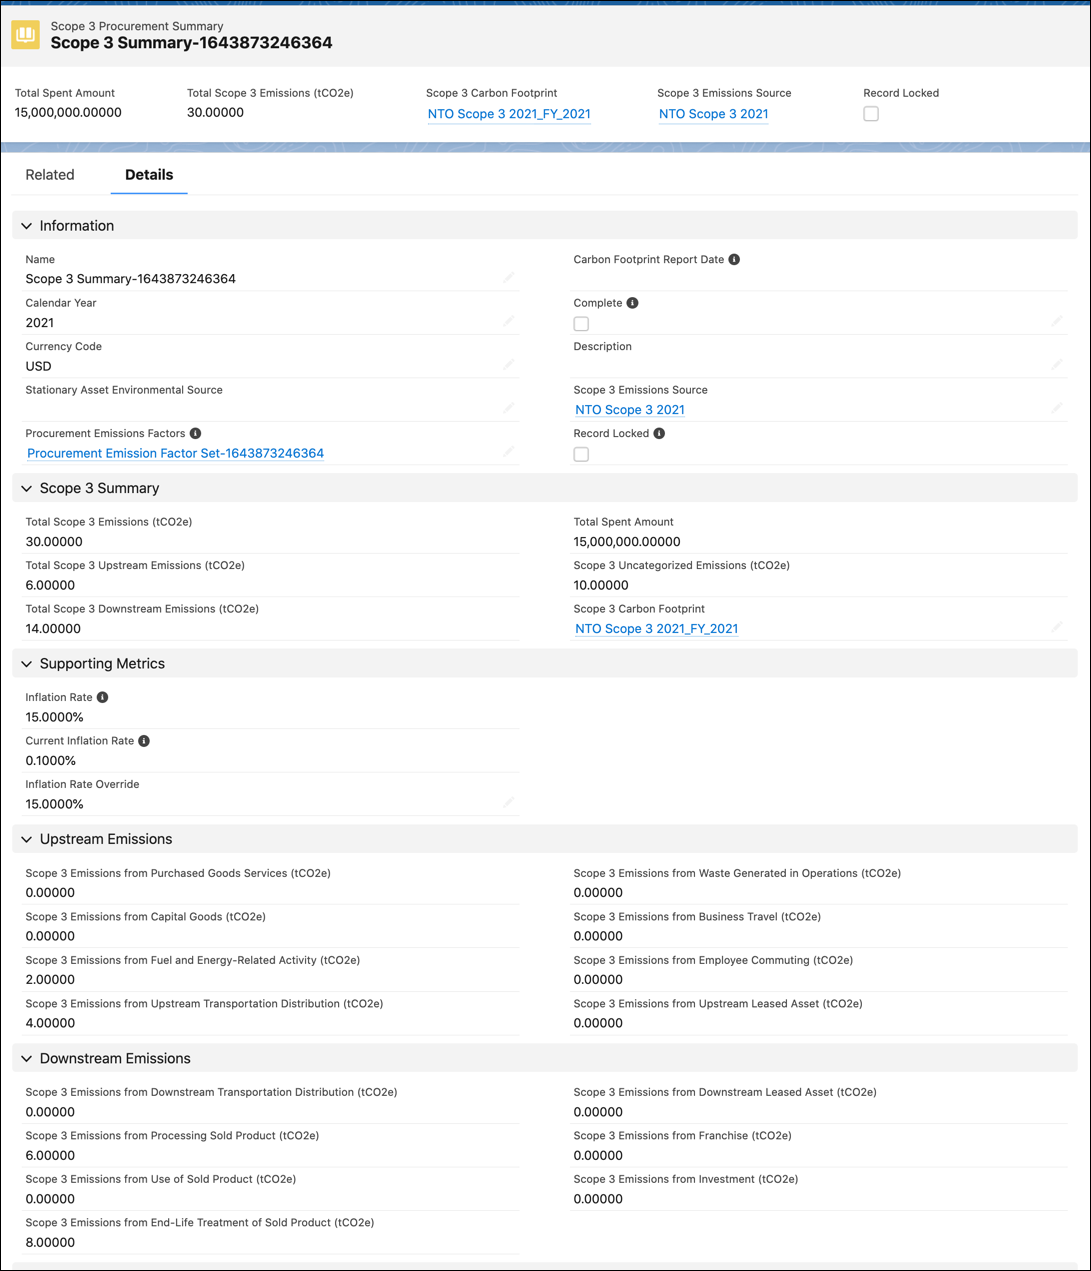
On a Procurement Summary record, Sam can see many key details. The details include the total spent amount, the current inflation rate, the calculated inflation rate based on the calendar year and currency, and manual override values, if any. The autocalculated total scope 3 emissions (tCO₂e) and the emissions from uncategorized items are also available. Furthermore, Sam can see a breakdown of emissions for each upstream and downstream Scope 3 GHG category.
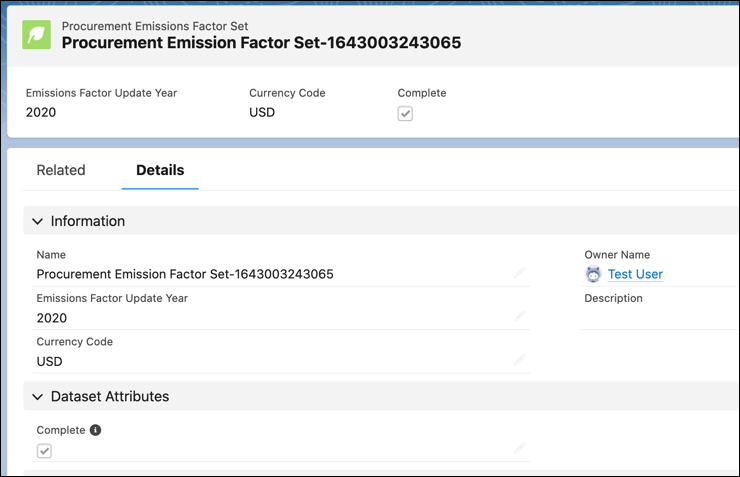
Procurement Emissions Factor Sets are the reference data used to compute emissions from spending amounts. These datasets are derived from econometric models run in a particular calendar year for a particular currency. Key details that Sam should pay attention to on these sets are Emissions Factor Update Year and Currency Code.
Many Procurement Emissions Factor Set Item records are associated with a parent Procurement Emissions Factor Set record. Each Procurement Item record for a specific GHG category is associated with a Procurement Item record for the same category. On a Procurement Emissions Factor Set Item record, Sam sets the Economic Sector Category code that helps recognize the economic sector and GHG category combination, and the EEIO specified emissions factor that converts the dollars spent into tCO₂e.

The USEEIO dataset that comes with Agentforce Net Zero is from an analysis performed in the year 2012. These analyses are very difficult, so they are not run and published very often. But when Sam is calculating emissions for procurements that took place after 2012, the cost data must be adjusted for inflation accordingly. An Inflation Rate record represents a single annual inflation rate for a specific year and currency, and is used to convert currency amounts. Inflation rates let you use emissions factors for scope 3 datasets across multiple years. How? By inflating or deflating an emissions factor’s total tCO₂e per million spent value to the procurement dataset’s year.

The categorized emissions (tCO₂e) from all Procurement Summary records are aggregated to the Scope 3 Carbon Footprint record.
Calculate Procurement-Related Emissions
Let’s take a simple example to understand how procurement-related emissions are calculated.
Procurement Item |
Procurement Emissions Factor Set Item |
Procurement Summary |
|---|---|---|
|
NTO specifies the amount spent in USD in 2021 to purchase plastic packaging for its products from third-party vendors. Spent Amount = $4,500,000 |
As per the GHG Protocol, purchase of packaging falls under the Purchased Goods and Services category. In the USEEIO dataset, the emissions factor for plastic packaging is 1.507 tCO₂e / million USD. |
The calculated value for total scope 3 emissions associated with the purchase of plastic packaging can be found on this record. Total Scope 3 Emissions (tCO₂e) = Spent Amount/1,000,000 * Emissions Factor = 4,500,000/1,000,000 * 1.507 = 7.459 |

Review Scope 3 Carbon Footprint
Sam is in the last lap of the race. He has explored scope 3 emissions calculations for business travel, transportation and distribution, waste management, and procurement activities. He must now look at the big picture and review all scope 3 emissions.
To account for all scope 3 emissions, multiple energy use records and procurement summary records are rolled up to a Scope 3 Carbon Footprint record.
Sam reviews the key data points available on a Scope 3 Carbon Footprint record.
-
Upstream Emissions: Sam can see a breakdown of emissions by each scope 3 upstream activity category as per the GHG Protocol. Examples include tCO₂e from purchased goods and services, employee commuting, business travel, and upstream leased assets.
-
Downstream Emissions: Sam can see a breakdown of emissions by each scope 3 downstream activity category as per the GHG Protocol. Examples include tCO2e from franchises, investments, end-of-life treatment of sold products, and downstream leased assets.
-
Scope 3 Summary: Sam can see the aggregate emissions for upstream and downstream total emissions. Based on the number of procurement line items that weren’t matched to GHG categories, the Scope 3 Uncategorized Emissions (tCO₂e) is also available for analysis.

Sam can also choose to create a Scope 3 Carbon Footprint record for each specific scope 3 category. Sam can associate the required energy use records and procurement summary records to select the activities he wants to calculate annual emissions for. While some companies choose to only track waste-based emissions with waste footprints, other companies associate generated waste records with a Scope 3 Carbon Footprint record to view a consolidated picture of all scope 3 emissions.
Take Charge of Climate Change
Sam has completed carbon accounting for all scope 3 emissions sources, including business travel, freight hauling, waste management, and value chain-based activities. So NTO has truly covered all the bases, and Sam can only thank Agentforce Net Zero for making the process a smooth and streamlined one! We hope Agentforce Net Zero can help you too in your journey to reduce your carbon footprint.
Resources
- Salesforce Help: Create a Scope 3 Procurement Summary Record
- Salesforce Help: Manage Procurement Emissions Factor Sets Data
- Salesforce Help: Manage Scope 3 Procurement Summary
- Salesforce Help: Create a Record for Scope 3 Carbon Footprint
- Developer Guide: Agentforce Net Zero Calculations