See Business Process Mapping in Practice
Learning Objectives
After completing this unit, you’ll be able to:
- Explain how a business process map captures all of the nuances of a process.
- Decide how much detail a business process map should go into.
- Explain the value of a business process mapping workshop.
Introduction to Ursa Major Solar’s Process Map
As Ursa Major Solar unifies customer data across sales, service, and marketing, its Salesforce solution architect, business analyst, and admin are taking a good hard look at their business processes. They want to define a new unified business process that looks at interdepartmental dynamics with a critical eye and focuses, most of all, on the customer experience.
For Ursa Major Solar, this isn’t a simple business process. It flows from journey to lead to revenue to service—there are many steps, and almost as many personas involved, from sales reps to marketers to the deal team. So how do the sales, marketing, service, and operations teams all work together to provide a seamless customer experience?
This is the million dollar question. And that’s where the power of Salesforce comes in.
Salesforce is the key to Ursa Major Solar’s customer-centric business model. It provides a single source of truth across every relationship in the business. Ursa Major Solar knows that connected business relationships provide for meaningful customer experiences.
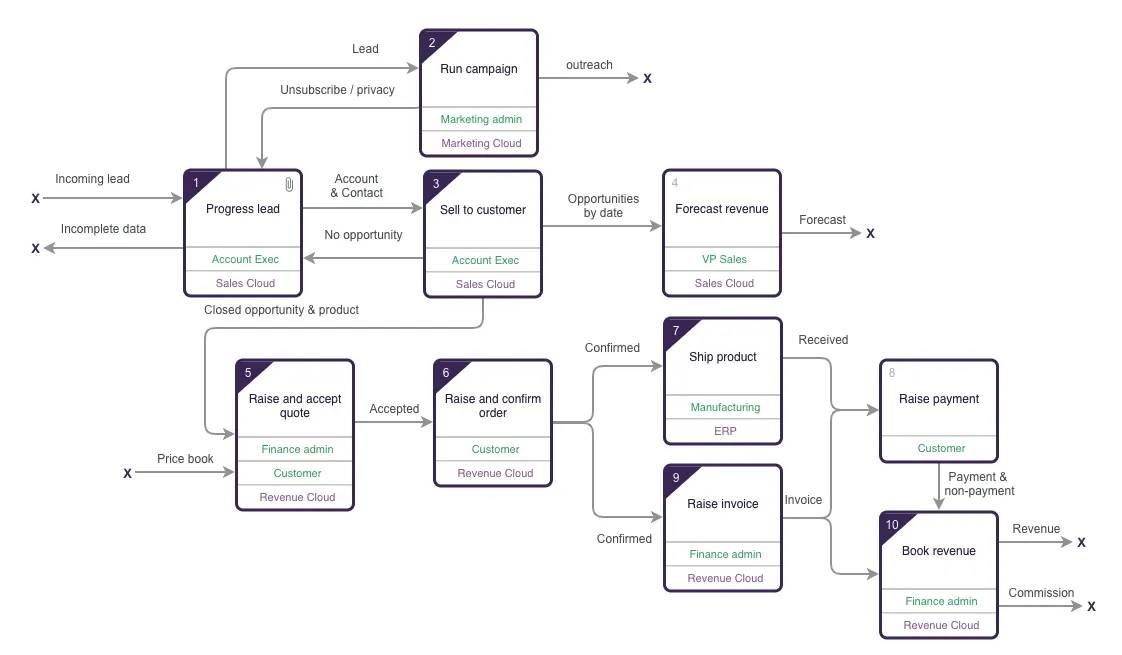
This diagram gives a high-level, marketing view of the process that we want to map out for Ursa Major Solar. All of the process diagrams in this unit are described using the UPN standard.

Level 1: Lead to Revenue
This process map describes the flow above. This diagram is the top level, or level 1. You can see that most of the steps in this diagram, represented by activity boxes, have another level of detail, shown by the top-left corner of each box. The lower-level diagrams go into more detail, and ensure that this top-level diagram is readable.

The process map begins with an incoming lead. If there’s incomplete data, the process ends. Otherwise:
-
Box 1—Progress lead: The account exec progresses the lead in Sales Cloud.
-
Box 2—Run campaign: If the lead score isn’t high enough, the marketing admin runs a campaign with Marketing Cloud Engagement.
- If the company successfully reaches out to the lead, the process ends.
- If the lead unsubscribes, the process returns to the progress lead step.
-
Box 3—Sell to customer: If the lead score is high enough, an account and contact are created in Sales Cloud and the account exec sells to the customer.
- If there’s no sales opportunity, the process returns to the progress lead step.
-
Box 4—Forecast revenue: If there are opportunities by date, the vice president of sales forecasts revenue in Sales Cloud and the process ends.
-
Box 5—Raise and accept quote: If the account exec closes the opportunity with a related product, the finance admin raises a quote to the customer using Revenue Cloud.
-
Box 6—Raise and confirm order: If the customer accepts the quote, the customer then confirms the order.
-
Box 7—Ship product: Once the order is confirmed, the manufacturing department ships the product using the ERP system.
-
Box 9—Raise invoice: Or, once the order is confirmed, the finance admin raises an invoice using Revenue Cloud.
-
Box 8—Raise Payment: Once the invoice is received or the product has shipped, the customer raises payment.
-
Box 10—Book Revenue: Once the customer pays and the invoice is completed, the finance admin books the revenue using Revenue Cloud.
The process ends with revenue for the company and a commission for the account executive.
For the sake of simplicity, we’ve made a number of assumptions about this process and the handoffs involved. In the real world, each step of the process is validated in a live workshop with stakeholders.
Mapping the lower-level diagrams makes the entire process map clearer and informs the assumptions we made in the top-level diagram. The scope of each lower level diagram is set by the inputs and outputs of the box you’re drilling down from, which means that as you drill down you are getting more granular in terms of inputs and outputs.
Level 2: Lead to Revenue → Progress Lead
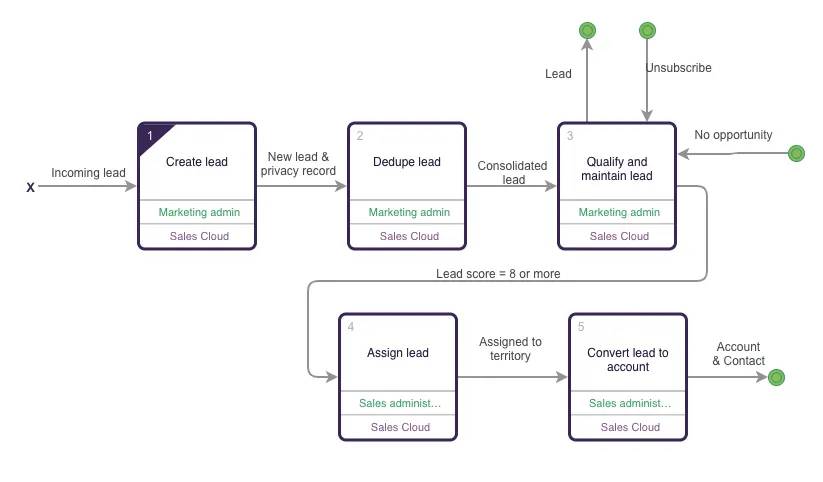
Here you can see that drilling down on the Progress lead box in the top-level diagram brings you to level 2, Progress lead. This map shows how a lead is created, qualified, and progressed.

This process begins with an incoming lead. This entire process takes place in Sales Cloud.
-
Box 1—Create lead: The marketing admin creates the lead.
-
Box 2—Dedupe lead: After the marketing admin creates a new lead and privacy record, they dedupe the lead.
-
Box 3—Qualify and maintain lead: After the lead is consolidated, the marketing admin qualifies and maintains the lead.
-
Box 4—Assign lead: If the lead score is 8 or more, the sales administrator assigns the lead.
-
Box 5—Convert lead to account: Once the lead is assigned to a territory, the sales administrator converts the lead to an account.
The process ends with the creation of an account and related contact in Sales Cloud.
But we’re not done yet—this process needs another level of detail. There’s still some information missing. For example, look at box 1, Create lead. There are a couple of open questions.
- What are the steps to create a lead? Are those steps different if the lead comes from a web form, an email, an import list, or a marketing partner?
- How are privacy records sourced and created to satisfy GDPR, CCPA and any other applicable privacy regulations?
There also needs to be supporting information. Remember that each box can have attachments to add context. There are two main types of supporting information.
-
Implementation assets: requirements, user stories, Salesforce metadata, entity relationship diagrams (ERDs)
-
Operational assets: notes, standard operating procedures (SOP), help topics, metrics, links to apps
Level 3: Lead to Revenue → Progress Lead → Create Lead
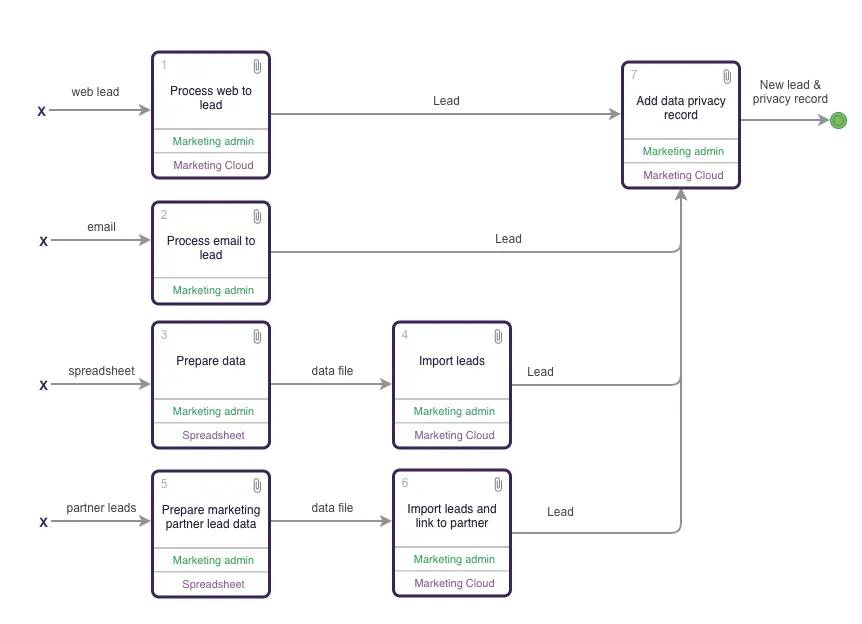
Let’s take this to the next (and final) level. This map shows us how a lead is created.
 This process begins with a lead that comes from the web, email, a spreadsheet, or a partner.
-
Box 1—Process web to lead: If it’s from the web, the marketing admin processes the lead in Marketing Cloud Engagement.
-
Box 2—Process email to lead: If it’s from an email, the marketing admin processes the lead in Marketing Cloud Engagement.
-
Box 3—Prepare data: If it’s from a spreadsheet, the marketing admin prepares the data in a spreadsheet.
-
Box 4—Import leads: Once they’ve prepared the data file, the marketing admin imports the lead to Marketing Cloud Engagement.
-
Box 5—Prepare marketing partner lead data: If it’s from a partner, the marketing admin prepares the marketing partner lead data in a spreadsheet.
-
Box 6—Import leads and link to partner: Once they’ve prepared the data file, the Marketing admin imports the lead to Marketing Cloud Engagement and adds a link to the partner.
-
Box 7—Add data privacy record: Once a lead is in Marketing Cloud Engagement, the marketing admin adds a data privacy record.
The process ends with the output of a new lead and privacy record in Marketing Cloud Engagement.
How Many Levels Should You Drill Down?
There’s no one-size-fits-all answer. Although the example above has three levels, different parts of the top-level process have fewer (or more) levels.
There are three drivers that determine how many levels of detail you need to describe a process.
-
Complexity: You need to add enough levels of detail to remove all ambiguity. If in doubt, add more detail. If a business process map leaves room for ambiguity, it wastes time and effort for both developers and end users.
-
Regulatory requirements: If a process has compliance obligations, it needs to be very specific—and version controlled—so that you can prove it’s being followed accurately and consistently.
-
User expertise: The less experienced the staff who are following the (new) process, the more prescriptive the processes need to be. They need supporting content linked to each process step. If the process is followed less frequently, more documentation is required. Think of the process as a self-serve help resource.
Think about a couple of examples. If you’re mapping the process for giving a sales presentation, you don’t need to detail every step and nuance. But the process—deliver presentation—might include links to standard sales decks, accelerators and notes on handling objections, links to the core objects and automation, and more.
What about the process of importing leads from a spreadsheet and adding data privacy permissions? This one is a bit different. It has multiple steps that need to be documented in great detail to ensure that they’re performed correctly every single time. Those steps include instructions for manipulating the spreadsheet, example blank spreadsheets, and screenshots of the setup of the data loader pages.
Process Mapping in Practice
Using live workshops to map out business processes is far more effective than asking stakeholders to complete a questionnaire or conducting individual interviews. While live workshops—either face-to-face or virtual—might seem like more work to put together, the benefits are huge. Here are a few just to start.
- A live workshop builds consensus in a group and generates ideas and quick wins for improving the process.
- Because you’re developing the process diagram live in the workshop, you don’t need to interpret notes or photos of whiteboards when you get back to your desk to build the process diagrams.
- It’s easier to get everyone to agree and sign off when participants see the process being developed and have a chance to give input.
Don’t underestimate how much time this saves, or the value delivered for extra time upfront.
Stakeholders are critical to this process. Make sure all the stakeholders who are engaged from input to outcome are in the mapping session. If anyone is missing, it invalidates the workshop because the power of process mapping is the collaboration and resolution of the process, not the documentation. As you drill down to lower-level diagrams, the scope will get narrower and there will be fewer stakeholders. Additionally, as the scope narrows, you’ll find that your workshops go more quickly.
During the workshop, the owner of the end-to-end process should set the scene, explain ground rules, resolve differences of opinion about the right process, and assign next steps.
Process Mapping in the Real World
You’ve learned what business process mapping is and why it’s useful, and seen its value firsthand with Ursa Major Solar. A business process map is a key part of the documentation that supports a Salesforce implementation. Rigorous business analysis, including a good process map, gets everyone on the same page, makes your team more agile, and leads to better solution architecture.
If you’re trying to evangelize process mapping at your company, start with a low-stakes process that will lead to some easy wins. And remember that you can always practice by mapping the real-world processes that you notice in your daily life, like going to the supermarket or filling up your bike’s tires.