Get Started with the Reports & Dashboards App
Learning Objectives
After completing this unit, you’ll be able to:
- List the analytic areas covered by the Agentforce Commerce for B2C Reports & Dashboards app.
- Explain how to set up user access to Reports & Dashboards.
- Describe how to configure the dashboard date range.
- Describe how to configure the dashboard filters to display a specific view of data.

Analyze That Data
Cloud Kicks specializes in high-end custom sneakers. As the company’s senior merchandiser, Brandon Wilson knows that accurate performance data is critical to Cloud Kicks’s success.

His storefronts use Salesforce Agentforce Commerce for B2C, which powers thousands of online shopping experiences across the globe. Brandon knows that each online customer experience generates useful data about his storefront. He’s excited to have a single source to access all that data. And even better, the data comes prefiltered and ready for him to analyze and apply to his storefront.
Today he’s exploring the Agentforce Commerce for B2C Reports & Dashboards app. He wants to take a look at the types of analytic data the app offers. He plans to use the metrics to fine-tune his storefront merchandising strategy.
What Exactly Is the Reports & Dashboards App?
The Reports & Dashboards app gathers, analyzes, and synthesizes fresh data from Brandon’s realm, and configures it into logical data sets called dashboards. Each dashboard presents trusted analytics that help him identify trends over time. This application does the tough stuff so he can concentrate on using the dashboards to help him manage, promote, and sell products and services on his storefront.
In this module, Brandon learns about the tool and how the dashboards deliver metrics he can use to fine-tune his storefront strategy and increase revenue.
Explore the Dashboards
The Agentforce Commerce for B2C Reports & Dashboards app is your single source to access operational performance measurements of critical functions on ecommerce sites. Each dashboard focuses on a key performance indicator (KPI) such as sales, products, site traffic, and the like. The dashboards show analytic data in the form of charts, graphs, and tables. Brandon can use this data to assess different facets of his site implementation. He can see where his site is exceeding performance goals, and identify performance issues.
Set Up User Access
Wow! Brandon is excited to find all these metrics in a single place. He’s ready to start using the dashboards, but first he needs access.
Your Account Manager admin grants you access to the Reports & Dashboards app. There are three Reports & Dashboards roles. The admin assigns only one role per user.
- Customer manager: Allows access to all reports and account settings.
- Performance user: Allows access to all reports.
- User: Allows access to all reports except the Real-Time performance reports.
Brandon needs access to all the dashboard functions, so his administrator assigns him the Performance User role.
Launch the Reports & Dashboards App
In this module, we assume you are a Agentforce Commerce for B2C merchandiser with the proper permissions to perform these tasks. If you’re not a Agentforce Commerce for B2C merchandiser, that’s OK. Read along to learn how your merchandiser would take these steps in a staging instance. Don’t try to follow our steps in your Trailhead Playground because Agentforce Commerce for B2C isn’t available in the Trailhead Playground.
If you have a staging instance of Agentforce Commerce for B2C, you can try out these steps in your instance. If you don’t have a staging instance, ask your manager if there is one that you can use.
Here’s how to launch the Reports & Dashboards app.
- In Business Manager, click App Launcher, and then select Merchant Tools | Analytics | Reports & Dashboards.
Depending on your system setup, you might need to log in with your Account Manager credentials before the Dashboard app launches in a new browser window. Once logged on, you can access the dashboards by selecting the dashboard tabs.
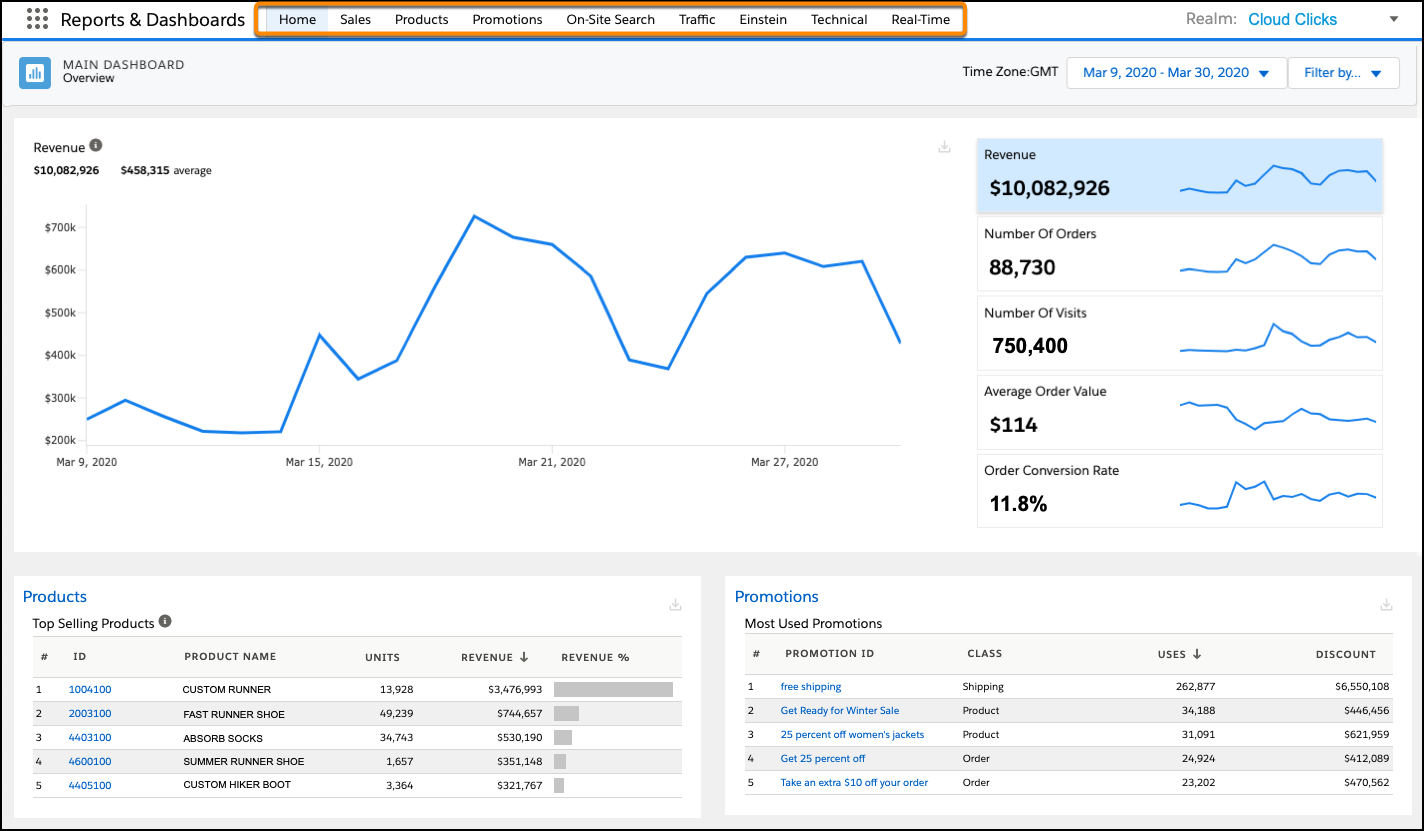
Let’s take a look at each dashboard.
Dashboard |
Description |
|---|---|
Main |
Shows a quick snapshot of key operating metrics, including revenue, orders, products, and promotions. |
Sales |
Shows sales metrics that give you insight into product sales and revenue. |
Products |
Reports on metrics related to your top-selling products and gift certificates. |
Promotions |
Helps you evaluate general promotion performance, individual promotion results, and promotion source code data. |
On-Site-Search |
Reports on aggregated search metrics across all your sites. |
Traffic |
Shows data about the visitors to your site. |
Einstein |
Provides insight on the performance of Agentforce Commerce Einstein Product Recommendations. The data can help you develop recommendation strategies that increase conversion and revenue. |
Technical |
Summarizes your server-side technical operations data, including pipelines and controllers. The Technical Open Commerce API (OCAPI) dashboard provides insight into your site’s OCAPI requests. |
Real-Time Performance |
Lets you view live sales metrics, such as the number of orders and baskets created. |
Customize Your Dashboard
With his user role set in Account Manager, Brandon is ready to customize the dashboards.
By default, each dashboard shows metrics at the realm level. A realm includes all the resources and configurations necessary to manage and operate all of your sites. One of the convenient dashboard features is that you can use the dashboard date range and filters to customize the data scope.
Date Range
Brandon knows that metric data is most useful when viewed over time, or for a specific time period—for example, the holiday shopping period. So he’s glad to see that the dashboards have flexible options for setting date ranges for the reports.
Excluding the Real-Time Performance dashboard, all the dashboards have a date range setting. The setting includes presets and a custom option. The preset date ranges are:
- Last 7 days
- Last 30 days
- Last 90 days
- Custom range
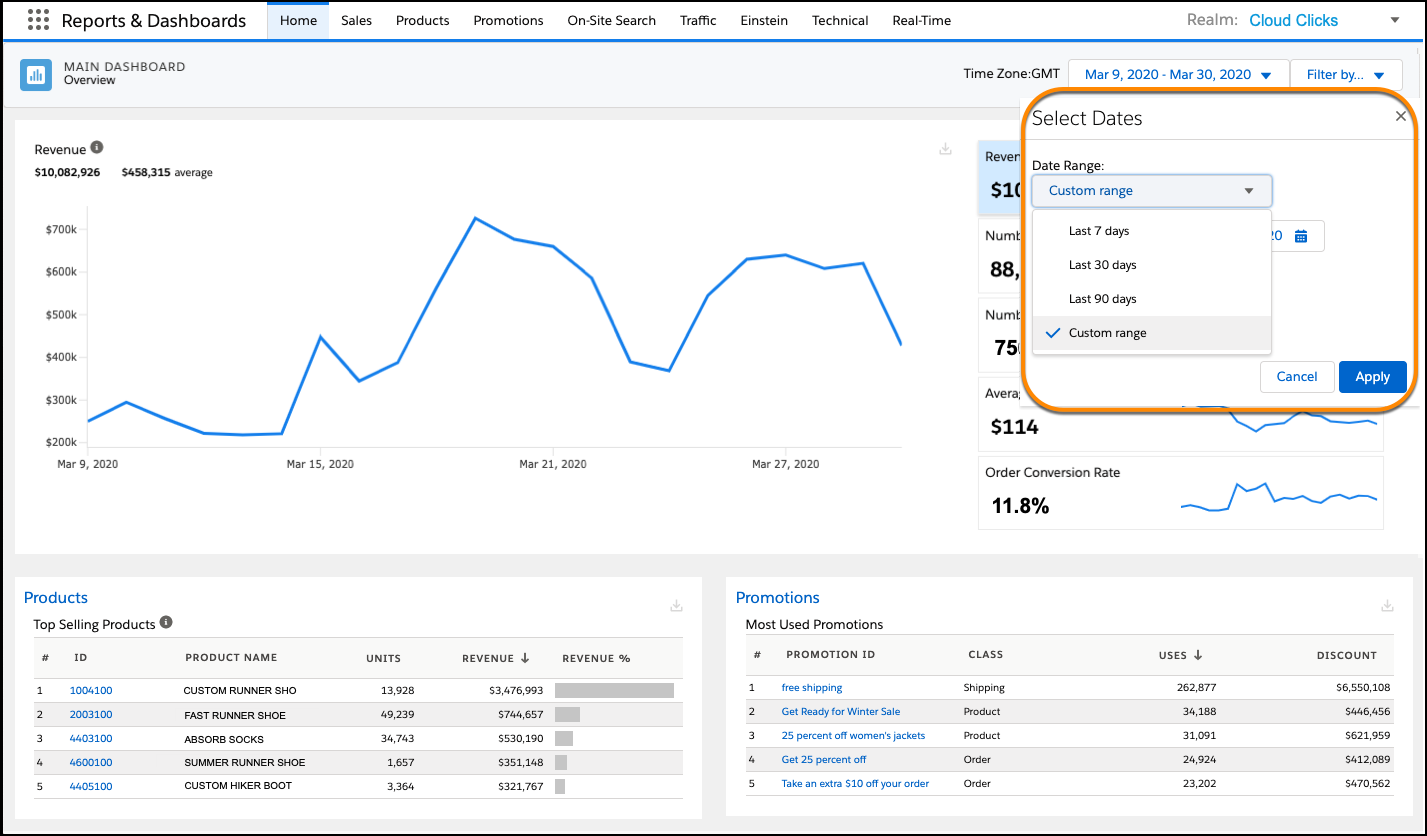
The Reports & Dashboards app can provide data back to January 1, 2017. In addition to setting a single date range, you can activate the compare date feature. You can use the compare date feature to review metrics over two sets of date ranges. For example, you can compare sales for the past two holiday seasons.
Filters
When Brandon first logs in to the Reports & Dashboards tool, the default filter settings are blank. Because the app collects data for the reports for all sites in a realm, the default reports reflect realm-level data. To narrow the data view, he uses the dashboard filters.
This table shows the filter settings.
Filter Setting |
Description |
|---|---|
Sites |
The sites your company operates. Most Agentforce Commerce for B2C implementations have multiple sites; together these are referred to as a realm. |
Device Types |
The type of device shoppers use to access and use the site. Tracked options include Desktop, Phone, Tablet, Unknown, or Unrecognized. |
Customers |
Site visitors who make a purchase. Customers are considered new or returning.
|
Customer Registration |
The site registration status of customers.
|
Channels |
The channels from where orders originate. These include: Storefront, Endless Aisle, Customer Service Center. |
Locales |
A storefront locale. |

To review a select set of data, Brandon can set a single filter or different filter combinations. For example, he’s reviewing order metrics on the Sales dashboard and wants to know how many new customers placed orders over the past month. To narrow the report view, he sets the date range to the last 30 days, and sets the Customer filter to New Customers.
Timezone and Realm Currency Settings
Your admin establishes the Reports and Dashboard timezone and currency settings when configuring the Reports & Dashboards app for your realm. Once set, these and other settings typically remain unchanged and should only be modified by your admin.
Next Steps
In this unit, you explored how the Agentforce Commerce for B2C Reports & Dashboards app can help you maintain a successful storefront. You learned what analytic areas the dashboards cover, how to gain access to the dashboards, and how to customize your view with the filters. Next, you take a closer look at the Main dashboard and see how it offers a broad view into the health of your storefront.
Resources