Ask the Right Questions Before You Build Your App
Learning Objectives
After completing this unit, you’ll be able to:
- Understand why you need to determine the audience and purpose for an app.
- Determine the audience and purpose for the example app.
Design with a Purpose
Let’s review.
Even a cursory look at The Motivator was enough to tell you that it needs work. With all due respect to your predecessor, something about it just isn’t right. You’ve stepped away from the immediate problem of redoing the app to think about its design. You’ve learned principles of design and a process you can use to reflect those principles in your development work. And now you’re ready to follow that process.
What’s your next step? Determining the purpose of The Motivator. Specifically, you need to identify an audience for the app, and why the audience would use it—what it does for them that they can’t do in another way. In other words, you need to determine the who and the why of the app.
Without that, you don’t have a starting point. Yes, your predecessor knew their way around data. They had a good understanding of how to get data into CRM Analytics and how to edit the dataflow so it included just the right data in the right structure. They had a good feel for creating dashboards. But they didn’t think about what anyone would actually do with those dashboards. So, the best result they could hope for was a hodgepodge of cool-looking charts that may or may not have answered any questions the sales team had about its data.
You decide to find out from a few sales managers what they need to know about reps’ activities to keep the business moving forward. Before your meeting, set up a version of The Motivator in a special Trailhead Developer Edition org.
Set Up a Developer Edition Org and Run the Dataflow
A free Developer Edition org is a safe environment where you can learn and practice new skills. You definitely need one as you work with the Motivator app. You also use it to run the Motivator dataflow to be sure data appears correctly in dashboards.

Let’s get you set up so you can log in and start working with CRM Analytics.
- Go to https://trailhead.salesforce.com/promo/orgs/analytics-de.
- Fill out the form.
- After you fill out the form, click Sign me up. A confirmation message appears.
- When you receive the activation email, open it and click the link.
- Complete your registration, and set your password and the challenge question.
Tip: Write down or remember your credentials. To log in, go to login.salesforce.com.
- Click Save. You’re now logged in to your new CRM Analytics Developer Edition org complete with DTC Electronics data.
Next, run the dataflow to be sure the data you analyze is up-to-date.
- From the App Launcher (
 ), find and select Data Manager.
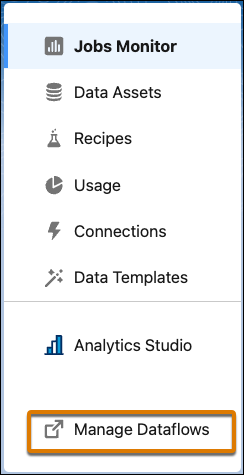
- In the bottom left, click Manage Dataflows.
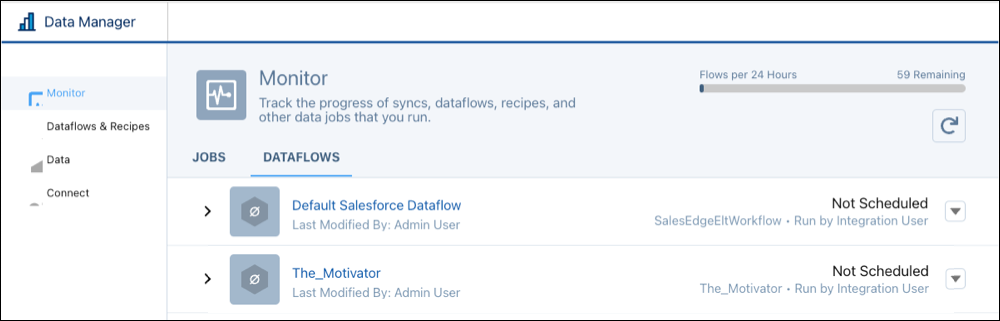
- In the Data Manager, under Monitor, select DATAFLOWS.
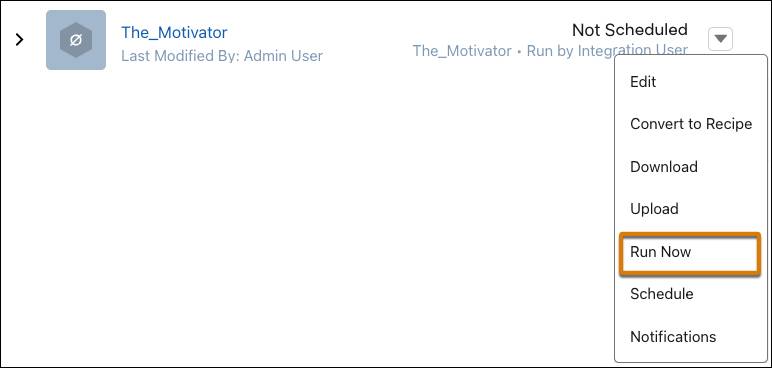
- To the far right of The_Motivator, click the triangle, and select Run Now. This runs the dataflow and any related data sync jobs.
- Click the Jobs tab to see the status of the data sync and dataflow jobs. The blue Running message changes to a green Successful when the dataflow finishes running.
That’s it. Your org’s all set up with fresh data, and you’re ready to start fixing The Motivator.
Make a Copy of the Motivator Dashboard
Now that you’ve created your special Trailhead Developer Edition org, look at the app and make a copy of the dashboard you’ll be working with. Later, you’ll modify the dashboard according to the principles and ideas you learn during your design journey.
- If you’re not logged in to the Developer Edition org that you signed up for in the previous unit, log in.
- From the App Launcher (
 ), find and select Analytics Studio.
Note: If CRM Analytics Studio doesn’t open, check to see if your pop-up blocker is on. If so, change the setting to allow pop-ups from your org. The first time you open Analytics Studio, the Welcome screen appears, offering resources to help you get started. You can dismiss it and use the Learning Center in the right-hand menu later if needed.
- From Analytics Studio, in the Search box, enter
The Motivator.
- In the search results, click The Motivator to open the app.
- Open The Motivator 1 dashboard.
- At the top right of the dashboard, click the More (
 ) button and select Clone in New Tab. A copy of the dashboard opens in edit mode in a new Analytics Studio tab.
- To save the copy, click the Save button.
- Name the dashboard
My Motivator, and click Save.
- To view the dashboard, click the Preview button.
Great, now you’ve got a version of the dashboard that you can work on later.

Understand Your Audience
You already scheduled time with the sales VP and her reports to show off The Motivator. You figure it’s a great way to break the ice, find out what they need, and let them poke holes in the dashboard, even in its preliminary state. Your goal from the meeting is to get enough information from the team to formulate a clear statement of purpose for the dashboard.
You kick off the meeting by telling the team about The Motivator. Then you ask them, “What key activities metrics do you want to see to track your team and keep everyone motivated?”
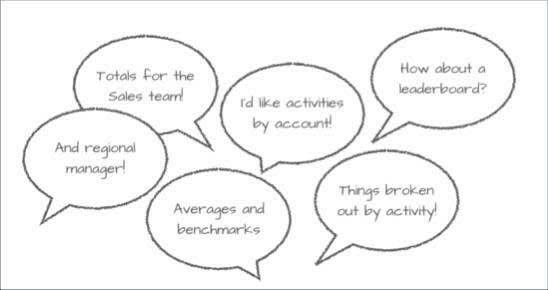
The team’s excited to have such an energetic Salesforce admin. Team members chime in with their wishes.
- “I’d love to see a leaderboard. Who are my busiest, most active reps? I’d love to recognize them and use them as examples for everyone else.”
- “Yeah—and I’d like to be able to identify the folks who can do more, so I can coach them.”
- “Can we get things broken out by type of activity? In spread-out geos, we do things mostly by email. In cities, we have lots of events. That can give me a better idea if my reps are doing the right things for their geos.”
- “To help benchmark each rep, I’d like to see the big picture—totals for the entire sales team and by region, and average levels of activity, too.”
- “What about the little picture, too? Can we see activities per account? Would be a great way to be sure we’re giving all our accounts the right amount of love.”
You’re glad to hear these requests because The Motivator has some of them already. So, you open up the dashboard.
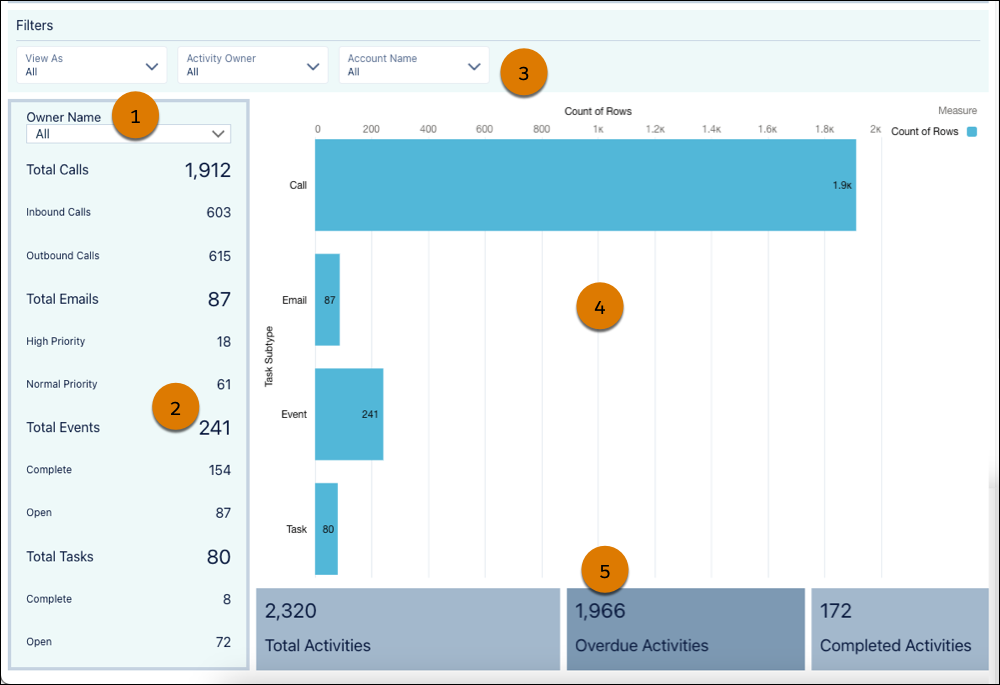
“Nice,” one of the regional managers says. “There’s a great bar chart, but…” And here it comes. One by one, folks around the room pick the dashboard apart.
- “Looks like things are jumbled together. Why is the Owner Name on top of a column of data that’s not really related to it? And why do they bleed together that way?” (1)
- “What’s with the different colors and type sizes and weights?” (2)
- “I can’t tell the time period. Is this for a year? A quarter? A month? Not very useful this way.” (3)
- “Could really use a benchmark, as I said before. Averages? Team goals for each type of activity?” (4)
- “Why are the totals way down at the bottom? Shouldn’t they be near the top?” (5)
Great feedback. Some of it you noticed, too. It’s great to have the confirmation and get input from the folks who’ll use the app. Of course, it’s one thing to have gut-level responses from stakeholders, quite another to determine how they add up to great design. You have some work to do.
You repeat back all the ideas and critiques to be sure you understand them. You put everything up on the whiteboard so you can take a picture of it. And with 5 minutes left, you ask if anyone wants to follow up with a session to whiteboard the dashboard of their dreams based on this initial feedback. Everyone’s excited to be part of the process, but a few members of the team seem to be particularly creative and vocal. So, you end the meeting a little early and invite those folks to a follow-up session.
You’ve completed the first step in determining your dashboard’s purpose: understanding your audience and its needs. Reflecting on that, you think you can clearly state the purpose.
“Give sales managers a way to measure their reps’ activities, by type, against a benchmark to keep everyone motivated and moving in the right direction. They need to know what each rep is doing, recognize top performers, and coach others who might be below the benchmark. And they need to be sure all accounts stay active.”
You drop that in an email to the team. Being an enthusiastic, engaged bunch, they get back to you immediately with a big thumbs up.
Audience Empathy
The team’s enthusiastic responses would be music to the ears of any designer. For an app to be useful for its users, you, as the designer, have to empathize with your audience. You have to understand their intentions, goals, and the actions they want to take. You have to feel their pain and understand how your app can ease it.
You’ve accomplished a significant part of determining your app’s purpose. Next up: Translate what you’ve learned into a set of specific design requirements for features. You do that next and even start fixing The Motivator.
But first, answer these questions to make progress toward your App Design Basics badge.