Get Started with Emissions Forecasting
Learning Objectives
After completing this unit, you’ll be able to:
- Identify the key technical components of the forecasting process.
- Explain Advanced Account Forecasting for Net Zero Cloud.
- Define the Data Processing Engine job templates.
- Describe the forecasting data flow in Net Zero Cloud.

Discover Forecasting in Net Zero Cloud
Safiya Rees is the Salesforce admin at Northern Trail Outfitters (NTO), a fast-growing retail company that’s committed to tackling climate change. Sam Rajan is NTO’s chief sustainability officer.
Safiya has set up a Net Zero Cloud org so that NTO can track, analyze, and report on greenhouse gas (GHG) emissions throughout its supply chain. She’s also configured the Climate Action Dashboard for NTO, which helps Sam analyze the emissions.
Sam has set the required science-based targets for NTO in Net Zero Cloud, but he needs a way to check how close NTO is to achieving the targets. He wants to use Net Zero Cloud's forecasting feature to generate accurate forecasts and track them. The feature also lets him adjust the forecasts based on planned emissions savings initiatives. Sam seeks Safiya’s help to set up forecasting.
In this module, we follow Safiya as she discovers the technical components of the forecasting process, sets up forecasting in Net Zero Cloud, and learns how the forecast calculations work. And we find out how Sam views forecasting results and adjusts forecasts.
The forecasting process in Net Zero Cloud has two key technical components.
- Advanced Account Forecasting
- Data Processing Engine Job Templates
Safiya finds out more about each component.
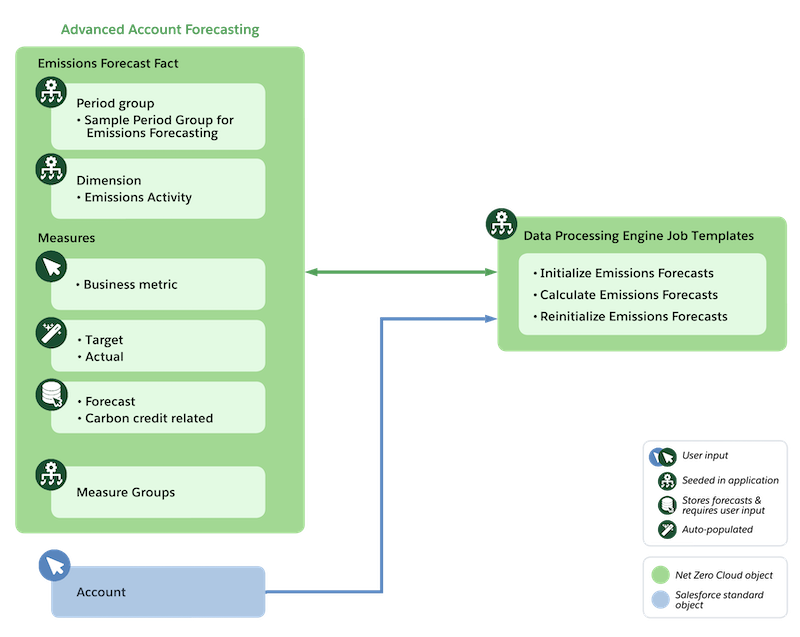
Advanced Account Forecasting
Net Zero Cloud uses the Advanced Account Forecasting component of Manufacturing Cloud. The basic configuration for forecasting is available out of the box in the default forecast set, Sample Emissions Forecast Set.
Let’s look at some key data that you’ll find in the Sample Emissions Forecast Set.
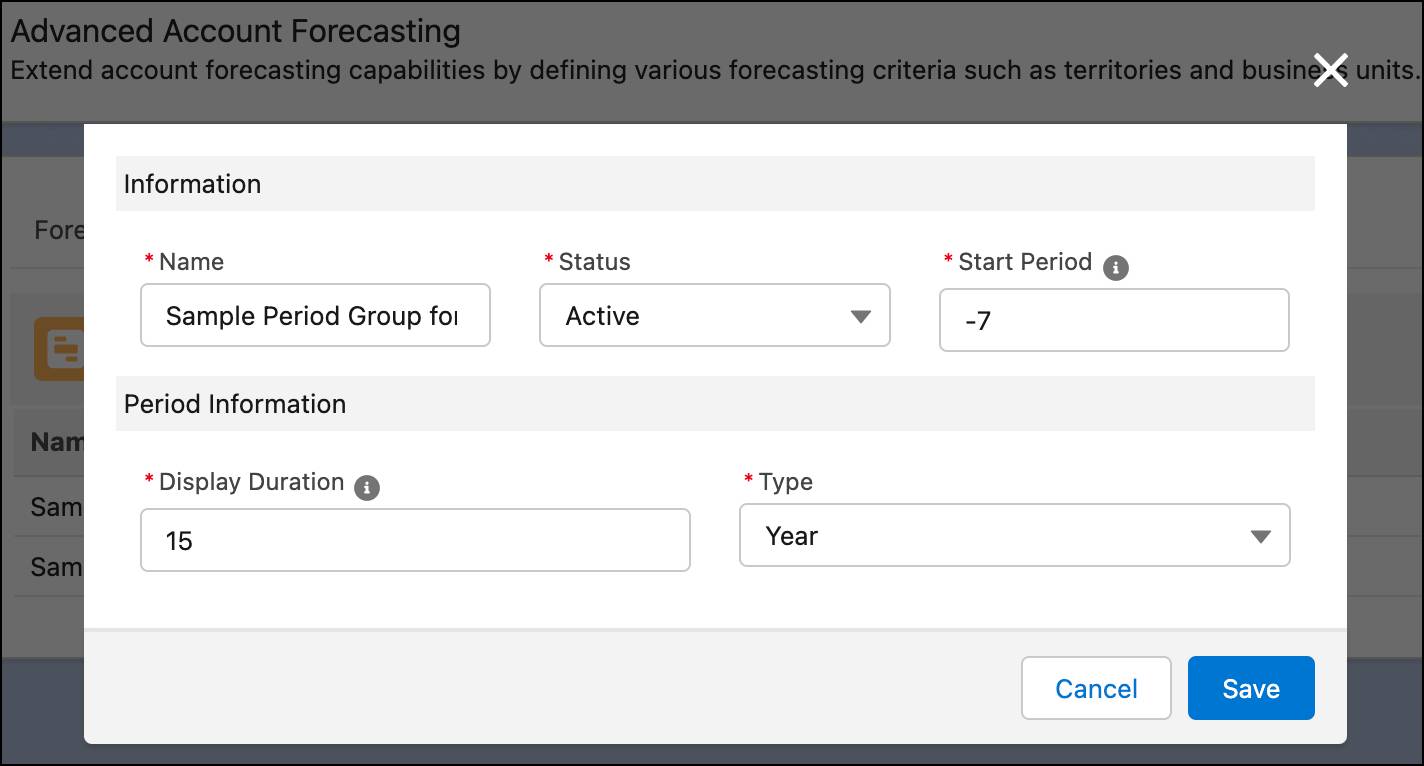
Period Group: Defines details of the period for which forecasts are generated. Sample Period Group for Emissions Forecasting is the default period group in Net Zero Cloud. As per its configuration, you can store forecasts for 15 years and historical data of the past 7 years. Net Zero Cloud supports only yearly forecasting.
Dimension: Defines what the forecasts are generated for. In Net Zero Cloud, forecasts are calculated for emissions activities, by year, for the overall company.
Emissions activities have three levels.
- The lowest level of emissions activities has assets and activities that generate emissions like Scope 3 Business Travel.
- The middle level is the scope category to which a lowest level emissions activity belongs, such as Scope 3.
- The top level, All Emissions, represents the total emissions for the company.
Emissions activities are based on the GHG Protocol Guidance and are predefined in the Emissions Activity object. You can’t add new emissions activities, or modify or delete existing ones. For a complete list of emissions activities, see Emissions Activities and Their Emissions Scope Categories.
Measures: Defines a set of metrics that are relevant for emissions forecasting.
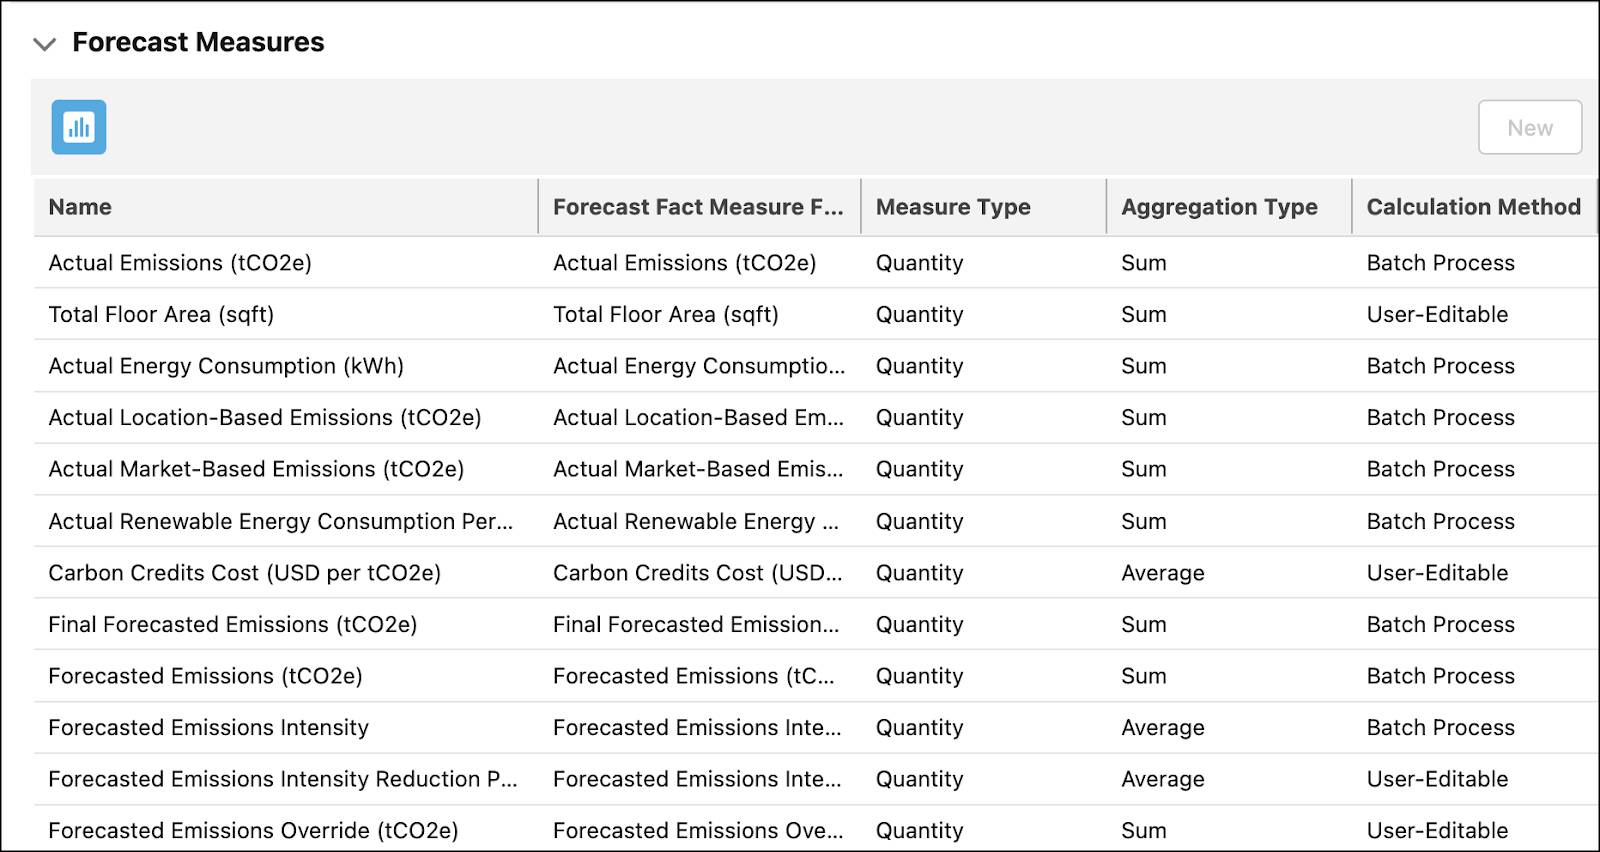
Measures are available per emissions activity per year. They can belong to one of these five measure types.
- Business metric: These measures act as key input factors in calculating emissions forecasts, such as revenue and total floor area. Every emissions activity is associated with a business metric. For example, forecasts for business travel are calculated based on revenue. And forecasts for scope 2 commercial building-related emissions are based on the total floor area.Business metric values must be specified for every emissions activity.
- Target: These measures are auto-populated during the forecasting process with target emissions, which are retrieved from an emissions reduction target record. Examples include Target Emissions and Target Compensated Emissions.An emissions reduction target record is created using the Science-Based Targets capability. All emissions activities might not have targets defined for them, in which case the targets stay blank.
- Actual: These measures are auto-populated during the forecasting process with actual emissions, which are retrieved from the annual emissions inventory records. For example, Actual Emissions, Actual Energy Consumption.An annual emissions inventory record is created using the Science-Based Targets capability. The forecasting process uses actual emissions data from the annual emissions inventory record of the previous year.
- Forecast: These measures are auto-populated with forecasting results that are calculated by the forecasting process. Examples include Forecasted Emissions and Forecasted Emissions Intensity. Some forecast measures can be manually updated to influence the forecasting results, or to override the derived forecasts. Forecast examples include Planned Operational Emissions Reduction and Forecasted Emissions Override.
- Carbon credit-related: These measures are auto-populated with carbon credits-related forecasting results that are determined by the forecasting process. For example, Required Carbon Credits is a carbon credit-related measure. Some carbon credit-related measures, such as Planned Carbon Credits and Carbon Credits Cost, can be manually updated to influence the forecasted carbon credits, or to calculate carbon credit investments.
For a list of available measures per measure type, see Measure Types.
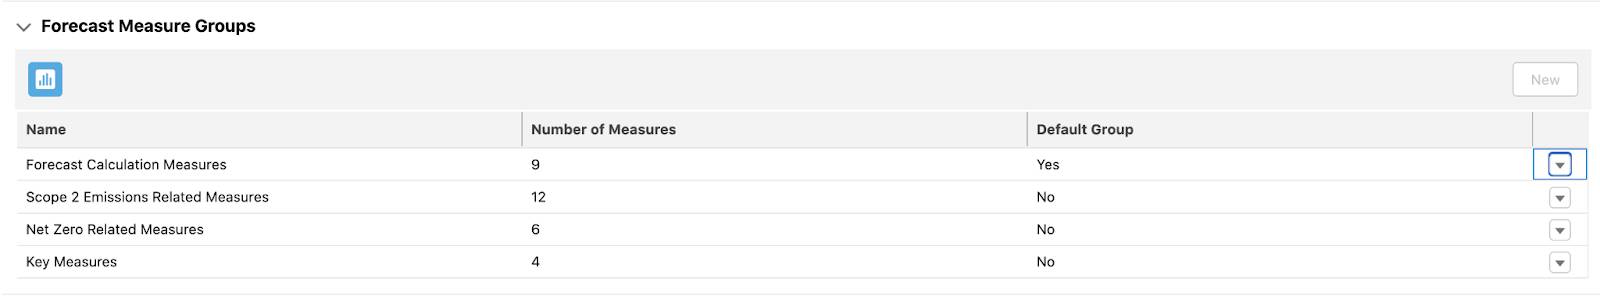
Measure groups: Defines groups of measures that filter and display selected measures on the user interface. Net Zero Cloud has four predefined measure groups. If there’s a need, you can create additional measure groups (more on this in the next unit).
Forecast Fact: Stores metadata such as period of forecasting and forecast dimension for forecasts. Emissions Forecast Fact is the default Forecast Fact object in Net Zero Cloud.
Having gone through Advanced Account Forecasting, Safiya studies Data Processing Engine (DPE) job templates.
Data Processing Engine Job Templates
Net Zero Cloud provides three out-of-the-box DPE job templates.
- Initialize Emissions Forecasts
- Calculate Emissions Forecasts
- Reinitialize Emissions Forecasts
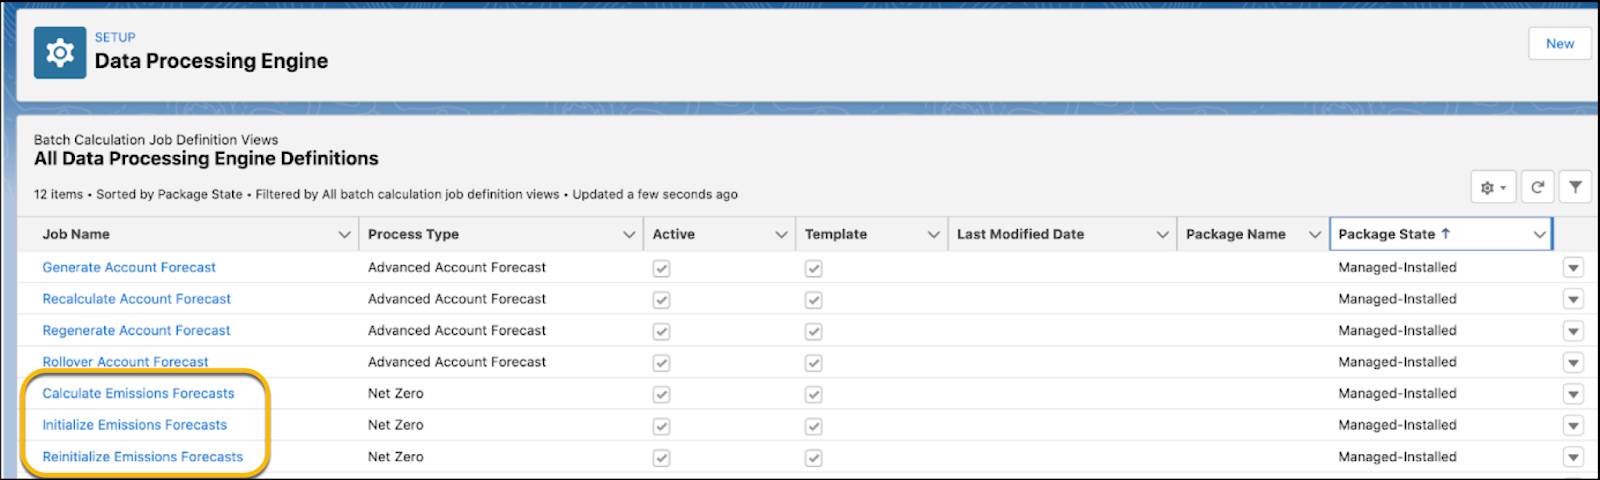
By default, the templates are not active. You must copy the templates and activate them to run DPE jobs. Let’s find out more about each template.
Initialize Emissions Forecasts
This template uses configuration information from the Sample Emissions Forecast Set. Running this template creates the metadata or structure of the emissions forecast fact record—one row is created per combination of emissions activity, year, and measure.
The template also creates the following.
- An advanced account forecast set partner record. This record serves as an entry point to the Advanced Forecast page.
- A forecasting grid on the Advanced Forecast page, based on the structure of the emissions forecast fact record.
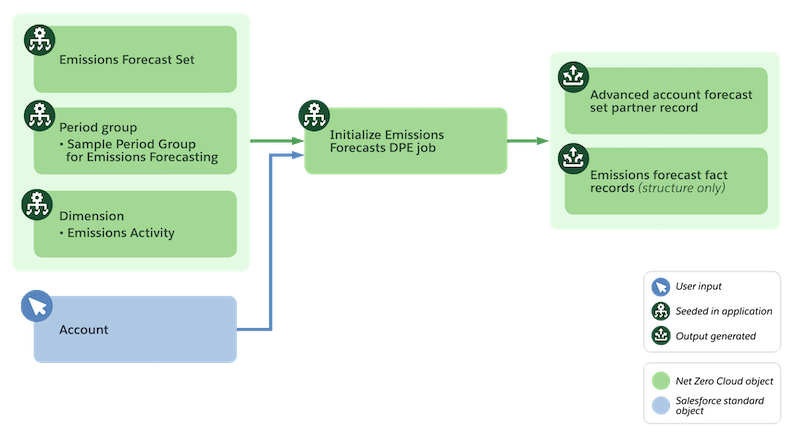
Because this template only initializes the emissions forecast fact record, the measures on the forecasting grid are blank and lack forecasting data. 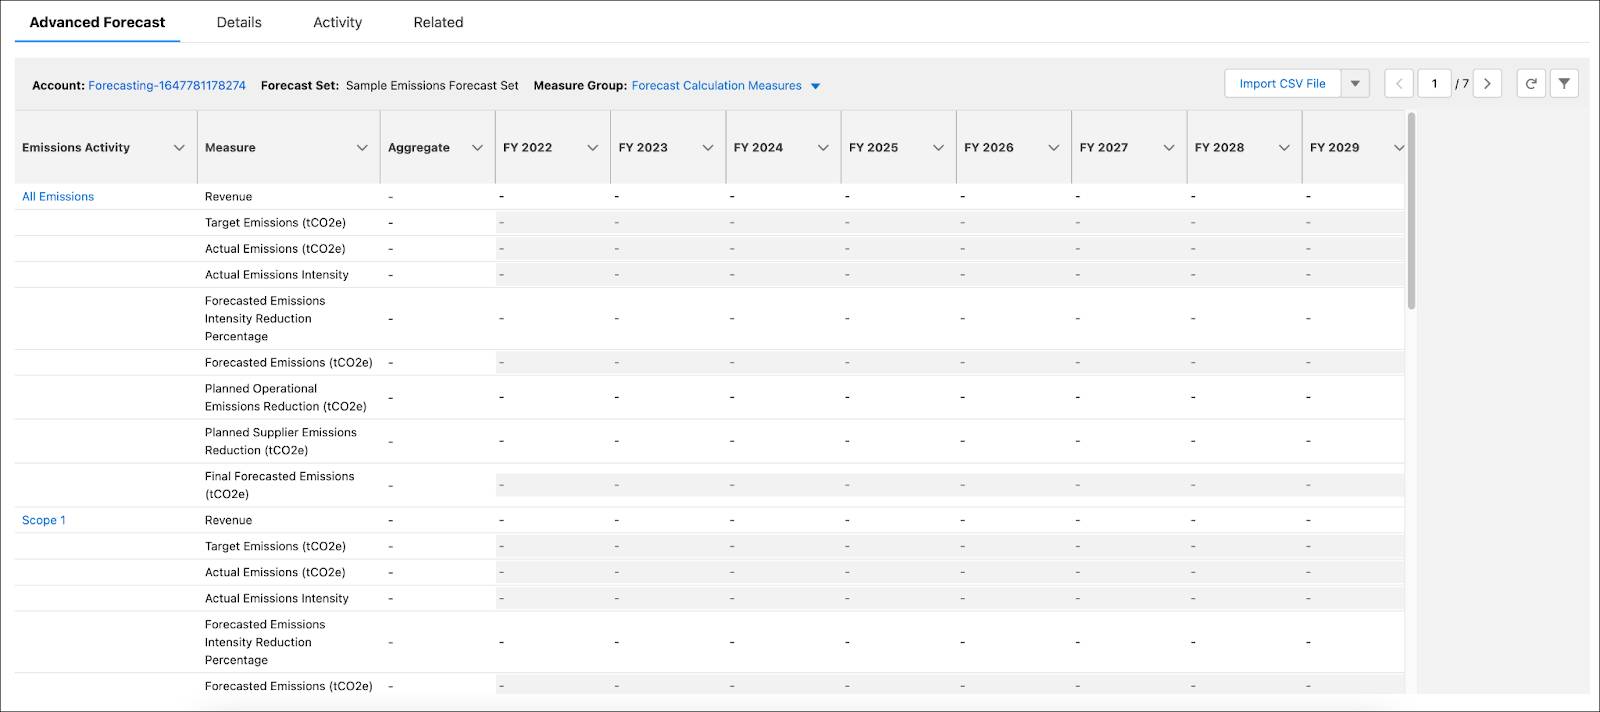
Calculate Emissions Forecasts
Here’s what this template does.
- Retrieves actual emissions from the annual emissions inventory record, target emissions from the emissions reduction target record of the previous year, and business metrics and other measure values that impact forecasting calculations.
- Calculates emissions forecasts and carbon credits, and updates the relevant measures in the emissions forecast fact record.
- Populates target, actual, forecast, and carbon credit-related measures on the forecasting grid.

Emissions forecast calculations in Net Zero Cloud are intensity-based.
Reinitialize Emissions Forecasts
When you run this template, it deletes the existing emissions forecast fact record and re-creates the structure of a new emissions forecast fact record. The forecasting grid on the user interface also gets reinitialized.
You must run the template if the period group definition changes. For example, run it if you want to change the forecasting period, or want to extend the forecasting period by another year in future when a previous year ends.
Running this template ensures that the structure of the emissions forecast fact record reflects the updated period group definition.
Safiya summarizes her understanding of the key technical components through a diagram.
After going through the components of the forecasting process, Safiya explores how data flows through Net Zero Cloud for emissions forecasts.
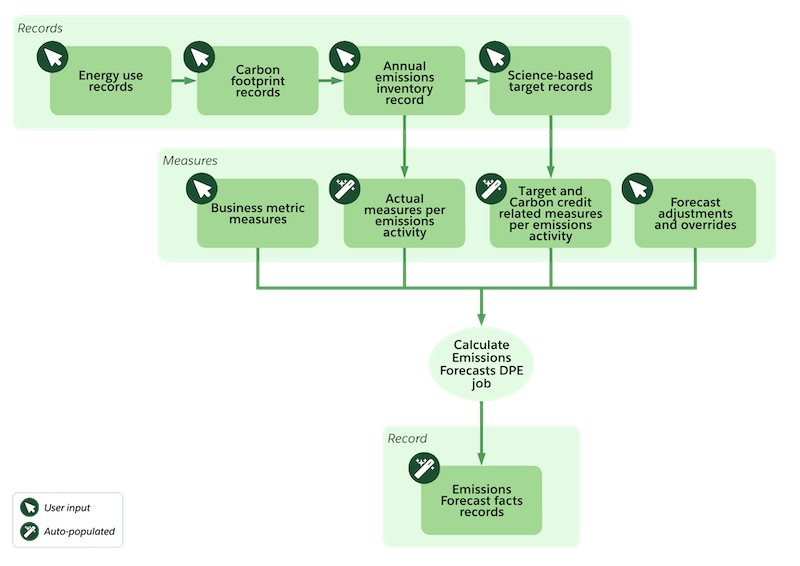
Navigate the Forecasting Data Flow
The flow of data through the forecasting process begins with energy use records. They capture the energy consumption data for an asset source and its emissions. Emissions from energy use records then roll up to related carbon footprint records.
Carbon footprint records across scopes for a year roll up into an annual emissions inventory record. Actual emissions data per emissions activity from this record and the business metric measures that you provide for emissions activities are used by the Calculate Emissions Forecasts DPE job to forecast emissions. The job also considers any adjustments or override measures. Target measures from science-based target records are compared against forecasts. And emissions forecast fact records get populated with forecast and carbon credit-related measures.
In this unit, we explored the technical components of the forecasting process in Net Zero Cloud, and how data flows through the process. In the next unit, let’s follow Safiya as she sets up and generates emissions forecasts.
Resources
- Trailhead: Net Zero Cloud Basics
- Trailhead: Net Zero Cloud Admin Essentials
- Trailhead: Net Zero Cloud Analytics Setup
- Trailhead: Carbon Accounting for Assets with Net Zero Cloud
- Trailhead: Carbon Accounting for Scope 3 with Net Zero Cloud
- Trailhead: Science-Based Target Setting and Emissions Forecasting with Net Zero Cloud
- Trailhead: Advanced Account Forecasting with Manufacturing Cloud
- Salesforce Help: Emissions Forecasting
- External: Greenhouse Gas Protocol Guidance